I’ve talked quite a bit about the home run spike occurring in baseball right now and the effect it has had on the fantasy game. It means there are fewer stolen bases, making them more valuable, and because home runs are more abundant, they are obviously less valuable. The extra power has really made me rethink a lot of prospects (cough, Eloy Jimenez, cough). We are quick to surpass even the dreaded “steroid era” as far as home run output, and there’s nothing opposing pitchers can do about it. Well, except maybe throw more sinkers and splitters, but that’s neither here nor there. Strikeouts abound and are increasing at an alarming rate, and baseball administrators are finally beginning to value the walk. Enter the era of the “three true outcomes” player.
For the uninitiated, the three true outcomes term comes from the concept that when a batter steps up the plate, even though there is a nearly limitless number of outcomes available to that hitter, he’s going to do one of three things: take a walk, strikeout, or hit a home run. I will forever associate this type of player with Adam Dunn, because in the mid-to-late 2000s when I first heard the phrase, he was the epitome of the term. Consider that in his career, Dunn had a 15.8% walk rate, 28.6% strikeout rate, and in 14 years racked up 462 home runs, averaging a dinger every 14.8 at-bats (side note: Adam Dunn was really good!). In 2012, Dunn had 110 hits, with 41 of those leaving the yard. That particular year saw his strikeout rate reach 34.2%, while he walked 16.2% of the time. Wow.
At the outset of this article, I decided to try to determine if there was merit to the idea that the three true outcomes were becoming less a trend and more a way of life for a lot of baseball players. Adam Dunn may have been the poster child for three true outcomes (here on out, let’s call it 3TO) players, but since his retirement in 2014, he’s been challenged by the likes of Mark Reynolds, Joey Gallo, Khris Davis (Chris Davis, too!) and more. So to determine this arbitrary concept, I need to have a baseline to hold players to. We are sliding more and more into an era where striking out is totally cool, so strikeout percentages have drastically risen in recent years. That means that a 3TO player in 2001 might be a bit different than a 3TO player in 2017.
All that said, I think there’s a really simple baseline to set up our frivolous experiment: Home runs, walk percentage, and strikeout percentage. That’s it. Those are the three things we will monitor to determine our answers. I’m also going to set a minimum plate appearance per season of 350 because I want to have a large enough sample size that we don’t get too muddled by an injury-plagued season or a fluky call-up. As far as home runs go, if we are going to assume a minimum 350 PA season as the baseline, we need to figure out what the minimum number of home runs in that span of a season should be. Let’s consider 30 home runs in 600 PA as a “plus” home run hitter. If we extrapolate that to our 350 plate appearances, we are left with a minimum of 17.5 home runs a season. Let’s round up and say 18 is our bottom-line number for a power hitter. Now, since 2000, the average strikeout percentage in MLB is roughly 18.5%. Let’s add another 6.5% to that to make it an even 25% for our 3TO hitters. Finally, in a similar mold to our strikeouts, the average walk percentage in that same span of time was about 8.5%. Let’s do the same thing and bump that number up to 10% for this endeavor.
Okay, so now that we have established what a 3TO player is (min. 350 PA, 18 HR, 25% K%, and 10% BB%), let’s dive right into the numbers.
Click here for complete study and spreadsheet analysis
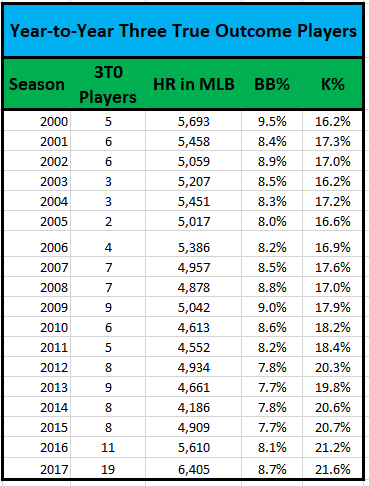
So discounting the early 2000s years, when hitting dominated, we can see that, for the most part, the number of 3TO players largely follows the same pattern as home runs hit. Of course, there is also that bizarre 2014 season when no one hit home runs, but I generally just leave it out of any analysis because it was such an anomaly. It’s also interesting to see how the walk rate doesn’t have much of a trend, particularly compared to the strikeout rate, which just continues to climb.
Then, of course, HOLY COW THAT NUMBER JUMPED! Once we get to the 2016 and 2017 seasons, we can see how insanely high the 3TO player numbers climb. An improvement of three from the previous year to 11 total in 2016 was a decent enough jump, but then it nearly doubles again going into last year with 19 total players. When I initially ran the numbers, I wondered if I had been too stringent with my rules, but once we made it to last year, I knew it had worked out. We can very obviously see a major philosophical change in hitting just by looking at these statistics. It makes me wonder what 2018 will look like …
It’s also worth pointing out that the names we find on this list tend to remain the same throughout each player’s respective career. Once Ryan Howard busted onto the scene with 58 homers in 2006, he made his first appearance on the list, and his name showed up every year during his prime except 2010 (when he walked only 9.5% of the time) until his eventual utter implosion began in 2012. Oftentimes the players who made it onto the list were guys who had short runs or singular big seasons. We see Bill Hall and Johnny Gomes in 2006, Chris Duncan in 2007, Jack Cust in 2008 and 2009, Jason Kubel in 2012, and Brandon Moss in 2014.
Of course, the champion of our 3TO contest is Adam Dunn. Dunn shows up on the list 12 times and nine years straight at one point. The year he missed was that season where he somehow received nearly 500 plate appearances and hit just .159 with 11 homers. What a bizarre career. Another fun fact is that, per Fangraphs.com, Dunn accrued only 25.4 WAR over his 14-year career despite annually hitting 40 homers and being a force in the middle of a lineup. Defense is crucial, kids.
All in all, this data isn’t likely to mean a whole lot going forward considering the way offense is headed. If I had a time machine, I could go back in time and use the information to point out how flawed a lot of these players were and how short their careers could be based on the data, but that’s about the extent of its usefulness. If I wanted to apply that logic to the 2017 members of the club, I would say the players to have doubts about would include Eric Thames, Luis Valbuena, Kyle Schwarber, Chris Davis, Miguel Sano, and Domingo Santana. I’m also kind of shocked to see Cody Bellinger on the list, as his strikeout percentage was higher than I thought at 26.6%.
In this day and age, strikeouts are a major part of the game. It’s our job to determine when those same strikeouts go from being an acceptable part of the game to being a major issue. Keep an eye on those players and act accordingly. And definitely keep an eye out next year to see how high the number grows!