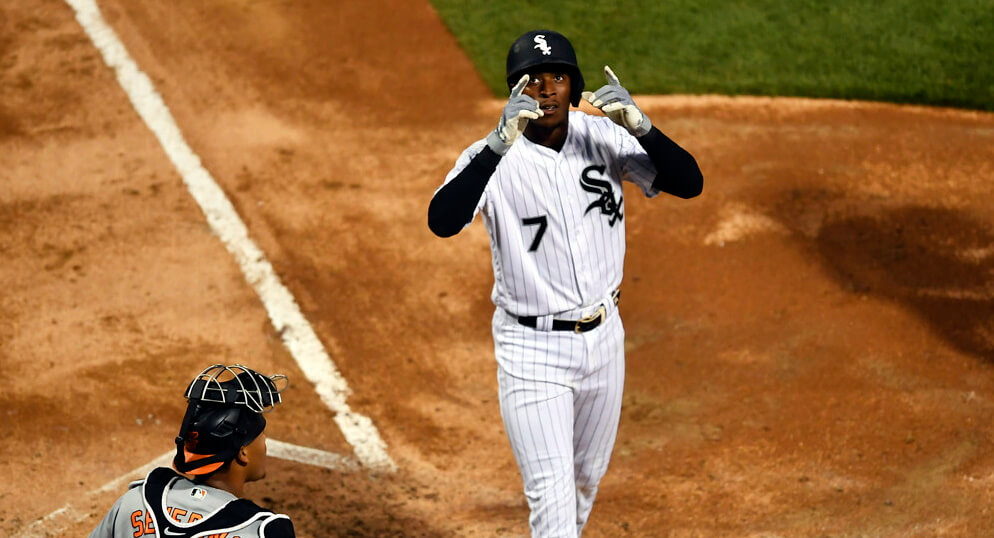
The 2019 batting champion, Tim Anderson, performed well once again in the 2020 shortened season. We won’t dig into whether a “batting champion” should mean a hitter with the highest batting average. However, we’re analyzing Tim Anderson for fantasy baseball purposes. Many also know Anderson as a guy with the notable bat flips that ruffles some feathers. Unwritten rules aside, you can tell Anderson loves playing the game. Enough of that, let’s start analyzing Tim Anderson.
In past seasons (2017 and 2018), he totaled 37 home runs and 41 steals but provided a mediocre .249 batting average. However, in 2019 and 2020, he reached a .331 batting average with 28 home runs and 22 stolen bases combined. So, what changed for Anderson? Can he sustain those changes with his rising ADP? As always, we’ll look at his surface stats and advanced metrics to deep dive into his profile.
What?! Your league didn’t use Fantrax in 2020? How’d that work out for you? Check out everything Fantrax has to offer and I’m sure you’ll come around to our way of thinking.
Analyzing Tim Anderson – Aggressive Approach & BABIP Monster
Past Production
Tim Anderson provided double-digit home runs and steals but struggled in the batting-average department earlier in his career. In 2018, Anderson hit 20 home runs with 26 steals but finished with a .240 batting average. Then in 2019, Anderson totaled 18 home runs and 17 stolen bases with a .335 batting average. We’ll dive into the potential reasons behind the increase in batting average later. In the meantime, let’s start by analyzing his surface stats, particularly over the past four seasons.
2017: 17 HR, 72 R, 56 RBI, 15 SB, .257 BA in 606 PA
2018: 20 HR, 77 R, 64 RBI, 26 SB, .230 BA in 606 PA
2019: 18 HR, 81 R, 56 RBI, 17 SB, .335 BA in 518 PA
2020: 10 HR, 45 R, 21 RBI, 5 SB, .322 BA in 221 PA
2020 Pace for 600 PA: 27 HR, 120 R, 57 R, 13 SB
We notice his batting average trending up over the past four seasons. Tim Anderson also accumulates more runs than RBI since he generally hits at the top of the lineup. However, outside of 2020, where he batted leadoff all season, Anderson moved up and down the lineup in previous years.
Batted Ball Profile
In the shortened 2020 season, Tim Anderson finished with a batted ball profile closer to his 2017 season, but not too far off from 2018 and 2019. When analyzing Tim Anderson, we notice his 18.9% line drive rate in 2020 dropped from 23.8% in 2019. Meanwhile, his 54.7% ground ball rate spiked from 48.6% in 2019. Anderson holds a 20.7% career line drive rate and 50.7% career ground ball rate, meaning his 2020 season looks slightly different than his career batted ball profile.
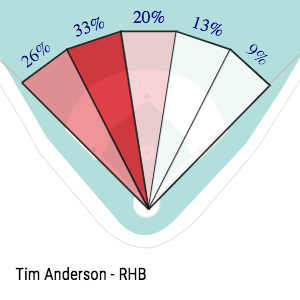
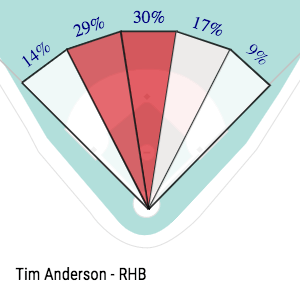
When analyzing Tim Anderson, one other notable change in his batted ball profile involves his ability to hit the ball to all fields. Interestingly, in 2019 and 2020, Anderson lowered his pull rate to about 10%, which coincided with the increased batting average. We notice these changes when looking at his infield slice chart on his Statcast page as well. Over the past two seasons, Anderson mostly used the middle of the field. However, in 2017 and 2018, he pulled the ball between 42.8%-44.4% of the time, which fell closer to his 39.9% career pull rate. Again, we note this because it appears Anderson changed his approach instead of pulling the ball most of the time. With this adjustment came significantly higher batting averages in 2019 and 2020. Whether it’s a direct connection or not, it’s something to note in his batted ball profile. Later on, we’ll also dive into his high BABIP since it jumped the past two seasons compared to 2017 and 2018.
Shaky or Not So Shaky Plate Discipline
Unsurprisingly, Tim Anderson sports a high 14.5% career swinging-strike rate that falls in line with his career 24.6% strikeout rate and 3.4% walk rate. Although his strikeout rate isn’t too high, Anderson rarely walks and holds a high chase rate. Outside of 2016, Anderson finished with an O-Swing% that ended up over ten percent higher than league average in three out of four seasons. The only year it didn’t finish ten percent above league average – his 2018 season where he finished with a 40.3% O-Swing% compared to the league average of 30.9%. Anderson also finished with zone swing and swing rates above league average, which made sense when considering his low walk rate.
Even though Tim Anderson swings a ton overall, his contact rates hover right around league average each season, with some seasons a few percentage points higher or lower. With that said, Anderson’s aggressive approach surprisingly doesn’t negatively impact his contact rates too much. The batted ball profile changes with the consistent plate discipline lead us to think – could Anderson sustain his recent success?
BABIP Monster
By now, many of us know that Tim Anderson’s a BABIP monster, particularly over the past two seasons. In his batting champion 2019 season, Anderson had a .399 BABIP. Last season he finished with a .383 BABIP compared to a .328 BABIP in 2017 and .289 BABIP in 2018. Although a league-average BABIP hovers around .300, Anderson typically displayed a high BABIP of .328 or higher outside of 2018.
When analyzing Tim Anderson, even in the minors, he rocked a BABIP ranging from .369 to .391, not including a couple of short stints in 2014. During his 2014 season, Anderson moved between three different levels and only spent five games in Rookie ball and ten games in Double-A. In summary, Anderson typically rocks a higher BABIP, which likely inflates his batting average. However, we shouldn’t expect his BABIP to regress to league average since he’s generally a high BABIP hitter. From 2017 to 2020, Anderson holds a .342 BABIP (No. 14) near hitters like Adalberto Mondesi, Ben Gamel, and Jeff McNeil.
Statcast Data
Outside of Tim Anderson’s expected stats, he ranks below average in exit velocity and hard-hit rate. With that said, we’ll briefly highlight some of Anderson’s Statcast data, then dig into his expected stats. Anderson had a 35.8% hard-hit rate (32nd percentile), 87.2 mph average exit velocity (23rd percentile), and 10.1% barrel rate (65th percentile). His hard-hit rate and average exit velocity hovered near his 2019 season, but his career-high barrel rate almost doubled his 5.1% barrel rate in 2019. Anderson also reached a career-high 93.7 mph average exit velocity on FB/LD (No. 113) in 2020, which finished three mph higher than his 2019 numbers.
Expected Stats
Over the past two seasons, Tim Anderson’s expected batting average ranked in the top ten percent of the league. He finished with a .296 xBA (92nd percentile) in 2019 and .293 xBA (91st percentile) in 2020. In both of those seasons, Anderson produced career bests in batting average with .335 in 2019 and .322 in 2020. Anderson’s .509 xSLG (84th percentile) and .347 xwOBA (77th percentile) in 2020 likely would’ve finished closer to his 2019 numbers over a full season. In 2019, Anderson finished with an xSLG and xwOBA slightly above average with a .471 xSLG (59th percentile) and .337 xwOBA (51st percentile). In general, his expected batting average seems to back up the improved batting average over the past two seasons in analyzing Tim Anderson.
Anderson Hits All Types of Pitches
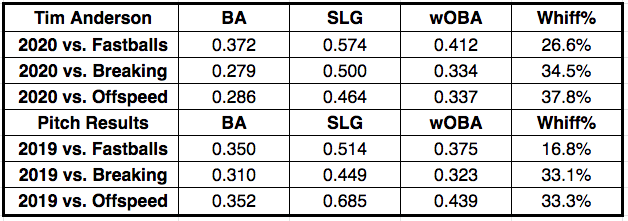
Over the past two seasons, Tim Anderson surprisingly hits well against all types of pitches. Although he faces mostly fastballs, his production doesn’t drop all that much against breaking and offspeed pitches. However, let’s note that he outperformed his expected stats across the board against the various pitch types. Although that’s the case, it’s positive to see that Anderson doesn’t struggle against a particular pitch type.
Reasons for Optimism & Concern
First off, we need to recognize that Tim Anderson proved relatively durable over the past four seasons. He only landed on the injured list twice in the past four years, once each in 2019 and 2020. Outside of that, the guy hardly misses any time. One of the reasons for optimism includes the reduced pull rate in 2019 and 2020 that coincided with the increased batting average. Instead of having a primarily pull heavy approach in 2017 and 2018, Anderson sprayed the ball to all fields the past two years. Another reason for optimism involves the consistent plate discipline and high BABIP throughout his major and minor league career. Anderson generally uses an aggressive approach with a high chase rate and swinging-strike rate but falls close to league average in terms of contact rates.
Tim Anderson is going to be a force for years to come. pic.twitter.com/aOg2w0Wvjd
— Chicago White Sox (@whitesox) October 21, 2020
Although one may think the high BABIP could or should regress to the league average, Tim Anderson looks like an outlier in several metrics. When we consider Anderson’s BABIP track record, we notice a consistently high BABIP throughout the majors and minors. A couple of other concerns involve the low walk rate and below-average quality of contact in average exit velocity, hard-hit rate, and xwOBA. However, Anderson’s xBA and xSLG finished ranked above average the past two seasons and seemingly backed up the career-high batting averages. Based on the past two seasons, Anderson should provide a solid 18-20 home runs with 15-20 steals and a .300 batting average with the potential for 150 runs plus RBI given the team context. However, he’s also risky due to his aggressive approach and high swing rates inside and outside the zone.
ADP Comparison
It appears that fantasy managers took notice of Tim Anderson over the past two seasons. In 2020, Anderson had a 121 Fantrax ADP and a 94 NFBC ADP. Meanwhile, with the early 2021 ADP, Anderson holds a 45.97 Fantrax ADP and 39.36 NFBC ADP. Overall, it’s a pretty large jump that puts him into the third or fourth round of 12-14 team leagues. On the Razzball player rater, Tim Anderson finished as the 28th player overall, sandwiched between Xander Bogaerts and Travis d’Arnaud. Bogaerts is an interesting comparison since he currently holds a 35.88 ADP on NFBC. However, the main differences with Bogaerts generally involve more home runs, higher runs plus RBI, and fewer steals with better plate discipline. If we compare two shortstops in Anderson and Bogaerts, I prefer Bogaerts with the safer floor. However, don’t discount Anderson’s production since he currently plays on a better offense overall.
The hot stove is barely starting to heat up, but FantraxHQ has been cooking all offseason! Keep track of all our 2020-21 MLB Offseason Analysis.

Fantrax was one of the fastest-growing fantasy sites of 2018/2019, and we’re not slowing down in 2020! With multi-team trades, designated commissioner/league managers, and drag/drop easy click methods, Fantrax is sure to excite the serious fantasy sports fan – sign up now for a free year at Fantrax.com.