Statcast data has become a passion of mine over the last year. During the season, I wrote a weekly piece titled “Statcast Trends,” where I scoured the data to find players that were trending up or down. I also published a series titled “How To Use Statcast Data” earlier this offseason. Over the next several weeks, I will be using Baseball Savant’s expected stats to look at some players who over or underperformed actual production. Today, we will look at players with expected home run totals higher than their actual output.
When looking at expected stats, especially one like xHR, you likely have questions. Are expected home runs a stable statistic? Is it predictive of future success? Do some players consistently outperform xHR rates? These are all great questions and ones that are worth exploring to determine whether this is a viable stat to use.
What?! Your league didn’t use Fantrax in 2020? How’d that work out for you? Check out everything Fantrax has to offer and I’m sure you’ll come around to our way of thinking.
Ben Clemens from Fangraphs did a study that found xHR to be predictive from the first half to the second half of the season. The study looked at the first and second half xHR rates from 2017 to 2019. The r-squared for the correlation was .465, meaning 46.5 percent of the variation in second-half home runs rates can be explained by first-half home run rates. The reliability of expected home run rates was also found to have a .642 r-squared correlation. Overall, I think this study shows that expected home runs is a statistic that is stable with also some predictive qualities.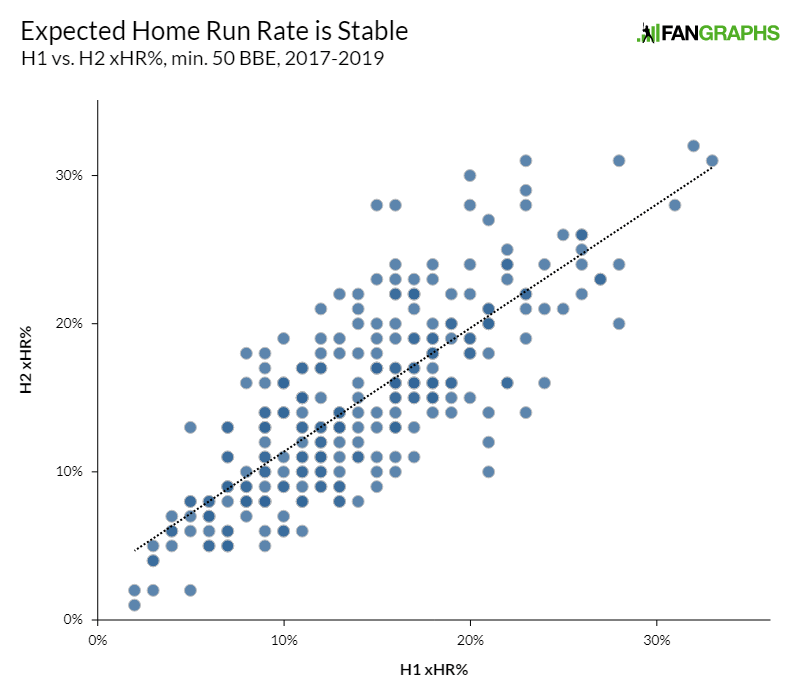
Expected Home Runs
Baseball Savant’s expected home run leaderboard is an awesome new feature on the site. The leaderboard shows the players actual home runs, no doubters(a home run at every stadium), mostly gone(a home run at eight to 29 stadiums), and doubters(a home run at seven or fewer stadiums). Statcast uses the formula of ballparks a home run would have been gone at divided by 30 to calculate expected home runs. For instance, if Corey Seager hits a ball that would have left the park at 16 stadiums, his expected home runs would have been put at .53. Any batted ball that would have been a home run in at least one stadium gets registered as an expected home run, even if it is just one out of thirty.
It is important to note that environmental elements are not factored into this. Elevation, wind, weather, and other factors do not matter. It would be interesting to see if they can incorporate factors like that in the future. Stats on Baseball Savant for expected home runs are for both regular and postseason combined.
Let’s check in on some players who underperformed their expected home run total and see if we can expect a higher power output in 2021.
Expected Home Runs: Over-Performers
Ian Happ, OF, Chicago Cubs
HR/xHR: 13/8.6
Ian Happ enjoyed a breakout season in the shortened 2020 after a hot start over the season’s first month. Through September 5, Happ was slashing .310/.418/.674 with 12 home runs. Over his final 77 plate appearances, he slashed just .159/.247/.188 with zero home runs and a 32.5 percent strikeout rate.
Happ was the largest overperformer in expected home run total. Including the postseason, Happ hit 13 home runs, but his expected home run total was 8.6.
Happ’s hard-hit rate was among the best in baseball at 48.5 percent. His average exit velocity also improved significantly to 91.1 mph in 2020. But, you can look at the rolling graphs below and see the struggles down the stretch.
Were the struggles from injuries? Happ did foul a ball off his eye in early September and dealt with an ankle injury down the stretch of the season. Despite the injuries, just four of his batted balls registered in the expected home run chart were after the injury. One was a “no-doubter,” and the other three would have only been a home run at one stadium.
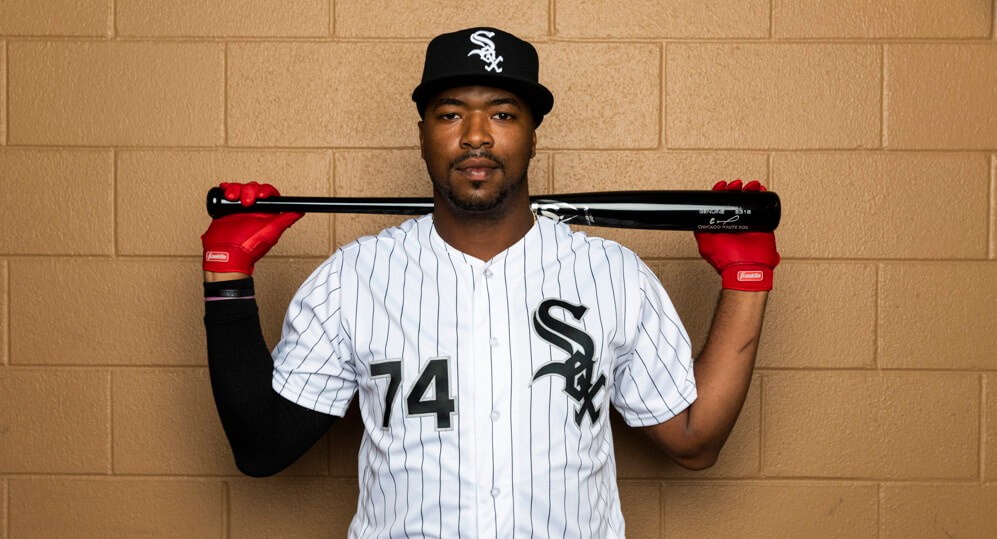
Eloy Jimenez, OF, Chicago White Sox
HR/xHR: 14/10.7
I was certainly surprised to see a slugger like Eloy Jimenez show up second on the list of xHR overperformers. After a 31 home run rookie campaign in 2019, Eloy improved every facet of his game in 2020. His strikeout rate dropped while also making improved, hard contact. That all led to his batting average jumping to nearly .300 while he hit 14 home runs over 226 plate appearances.
The statcast data fully supports Jimenez’s strong season as he posted an average exit velocity of 92.2 mph. But on line-drives and fly balls, that number was at 97.7 mph, 12th best among all hitters. Eloy’s hard-hit rate was also among the best in the league at 55.7 percent, and his barrel rate was fourth-best in baseball.
All this to say, when you look deeper, I would not be overly concerned about Eloy Jimenez being classified as an expected home run overperformer. Only four of his home runs hit had an exit velocity less than 100 mph. The lowest of those four was 98.4 mph.
Eloy is a favorite target of mine at going around pick 40. He has shown that he has progressed at the plate and could be a legit four-category threat in 2021.
DJ LeMahieu, 2B/3B/1B, Free Agent
HR/xHR: 10/6.8
DJ LeMahieu is an extremely polarizing player in the Fantasy community. A lot of his value really depends on if he re-signs with the Yankees. Just check out this tweet from Eric Cross below. Yankee Stadium was tailormade for LeMahieu. While his slash line may be much better in Coors or Yankee Stadium, the power is also tied to certain places.
D.J. LeMahieu by park:
COL: .329/.386/.447
NYY: .359/.414/.628
All Other Parks: .275/.322/.380
His value largely hinges on where he signs, but I'm 100% out at his NFBC ADP of 28.1.
Still going to be good? Yes
Going to be top-30 elite? Unlikely if not in NYY#FantasyBaseball— Eric Cross (@EricCross04) December 30, 2020
DJ LeMahieu comes in as the third-largest overperformer of expected home runs. He hit 10 home runs in 2020 but had an expected number of just 6.8. Look, another great Tweet about LeMahieu from Mike Kurland. Only two of his home runs had an exit velocity over 100 mph, with the max being 101.3 mph. Since 2019, 27 of his 36 home runs were in Yankee Stadium, with 16 of them going to the opposite field. Just one of his home runs in 2020 was classified as a “no-doubter” that would have been a home run at every stadium. It was hit just 100.5 mph and traveled a distance of 397 feet.
If DJ Lemhieu does re-sign with New York, I would not be concerned with a decline in his production. But if he moves elsewhere, I struggle to think he performs at a high-end level like he has the last two years. Will he be good? Yes. Elite? Probably not.
Fun stats for DJ LeMahieu
Only 2 HR in 2020 had an exit velo over 100 MPH. W/ the hardest hit at 101.3 MPH
Since 2019, 27 of his 36 HR been at NY – 16 were oppo in NY
In 2020:
Career-low Avg. LA (2.3 Deg.) & Barrel% (2.9%)
GB% ⬆️ to 57.1If DJLM leaves NYY, fantasy stock ⬇️ pic.twitter.com/FbQcCg56ym
— Mike Kurland (@Mike_Kurland) November 30, 2020
Kyle Lewis, OF, Seattle Mariners
HR/xHR: 11/8.5
Kyle Lewis was once a high-end first-round draft pick and prospect but fell from grace quickly as he struggled with consistency in the minors. Lewis turned it around in 2020 as a strong start to the season allowed Lewis to coast to the American League Rookie of the Year award.
It was a tale of two halves for Lewis, who, through 30 games, was slashing .360/.446/.568 with seven home runs and two steals. Over his final 30 (28 games played), Lewis slashed .147/.268/.284 with four home runs and three steals. The question remains, who is the real Kyle Lewis. Likely closer to his final line of .262/.364/.437 with 11 home runs.
Lewis did come in as the sixth-highest over performer for expected home runs. Lewis was always thought of to have big, raw power as a prospect, but he had failed to convert it to game power until this season. His home run power also often comes in bunches. So it will be hard to expect consistency out of Lewis. There is an upside to taking him at his current ADP of 115, but the floor is also low.
Toronto Blue Jays Hitters
Not a single Toronto Blue Jays hitter had an expected home run rate higher than their actual output. Every single hitter “overperformed” their expected output. Other than Teoscar Hernandez, nearly every Blue Jays hitter had a much better home than road split. Was this a matter of the ballpark they played at in Buffalo?
Sahlen Field played as the most favorable home run park for left-handed hitters in all of baseball. The only lefties in the Blue Jays lineup are Cavan Biggio, Rowdy Tellez, and Derek Fisher. But even for right-handed hitters, Sahlen Field played very favorable for home runs.
Biggio hit eight home runs in 2020, but his expected number was just 5.8. Tellez also hit eight home runs, but his expected number was 7.1. Other Blue Jays who were notable overperformers were Randal Grichuk and Teoscar Hernandez.
Randal Grichuk enjoyed a breakout season, hitting 12 home runs in 55 games, with an expected total of 9.7. Grichuk has always had immense power and has put it on display with the Blue Jays the last three seasons. Grichuk also posted a .273 batting average, which was his highest since 2013. I would not be concerned about him overperforming his expected home run totals as much as I would his batting average taking a dip closer to his career .246 average.
Teoscar Hernandez’s breakout, on the other hand, felt legit. Another power hitter with a poor batting average. Hernandez hit 16 home runs, with an expected total of 14. He also posted a career-high batting average of .289, significantly higher than his career .241 average before 2020. Hernandez posted statcast data off the charts, including a .295 expected batting average. I would not expect Teoscar to hit .290 again, but he should be a great source of power and speed again in 2021.
The hot stove is barely starting to heat up, but FantraxHQ has been cooking all offseason! Keep track of all our 2020-21 MLB Offseason Analysis.

Fantrax was one of the fastest-growing fantasy sites of 2018/2019, and we’re not slowing down in 2020! With multi-team trades, designated commissioner/league managers, and drag/drop easy click methods, Fantrax is sure to excite the serious fantasy sports fan – sign up now for a free year at Fantrax.com.