Did someone say exit velocity? The stat that gets baseball analysts and fans going. Average and max exit velocity are popular metrics often quoted by baseball analysts. These numbers were first introduced in 2015 when Major League Baseball introduced Statcast. But what do they mean?
What is Exit Velocity?
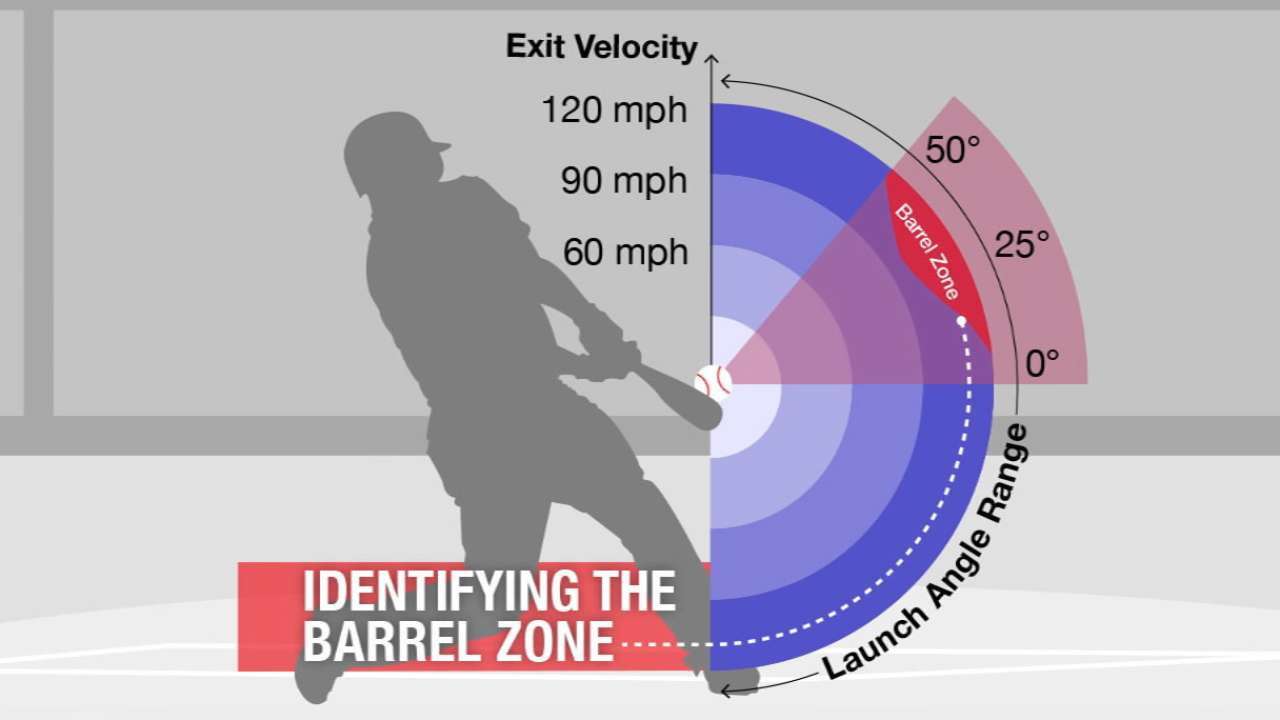
Exit velocity is defined as “the speed of the baseball as it comes off the bat, immediately after a batter marks contact,” according to MLB. Therefore, average exit velocity is a hitters sum or all exit velocities divided by all batted ball events. Max exit velocity is the exit velocity of a player’s single hardest-hit ball in a particular season.
With those defined, what are percentile exit velocities? It is simply the average of batted ball events within the nth percentile of a player’s data. Often there are misreads or singular outliers, making max exit velocity a little noisy. Using 80th or 90th percentile exit velocity still looks at a player’s high-end outcomes; it eliminates the possibility of a misread or a massive outlier in players’ batted ball data. Could using nth percentile exit velocity better correlate with other metrics and lead to a better method of future power output?
All data points were pulled from Baseball Savant and Fangraphs for hitters who had at least 250 plate appearances in a season(excluding 2020’s shortened season). I downloaded individual batted ball data for all of these hitters and ran percentiles on their exit velocities. Over 2000 data points were tested. It was a long process, but you can find the results in a database linked below.
Link to Exit Velocity Database
Using Exit Velocity Percentiles for Fantasy Baseball
Why It Matters?
A common perception is that a player who hits the ball harder increases their chances for a hit, especially for home runs. But, studies show a non-linear correlation between home runs and exit velocity. So, that leads to the question, does average exit velocity have value in Fantasy Baseball analysis? What about max or an nth percentile exit velocity?
Here is why it matters. Take two players on the St. Louis Cardinals, one with monster power and one with closer to average power. One of those players had a 114.6 mph max exit velocity, while the other had a 113.1 mph max. The two players are Edmundo Sosa and Tyler O’Neill. If I let you take a guess on which you thought was O’Neill’s, I’m sure you would guess 114.6. Sadly that is incorrect. Edmundo Sosa had a max exit velocity 1.5 mph higher than O’Neill, which seems crazy. Check out the chart below to see just how different the two’s quality of exit velocities were.

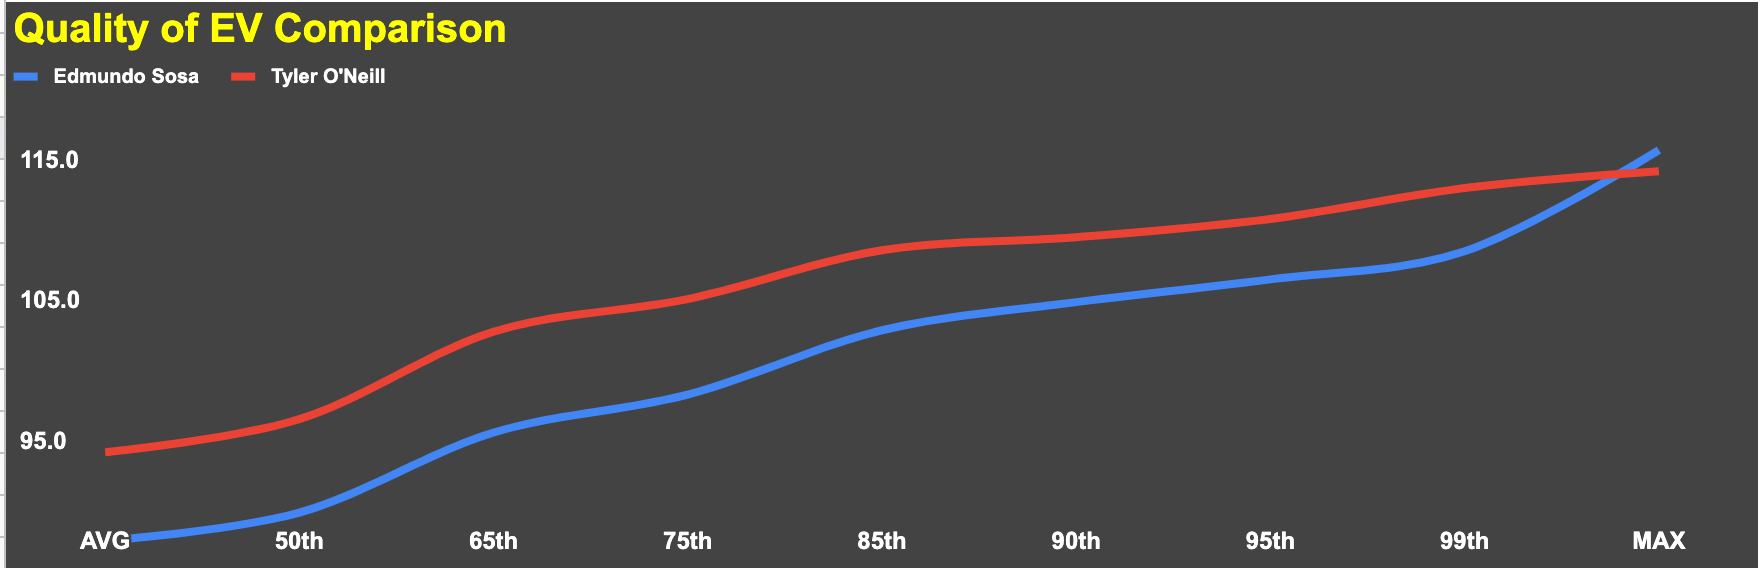
While Sosa draws a nice 1.5 mph edge with his max, the difference is staggering. If you drop to the 90th percentile, O’Neill has the edge by 4.6 mph, which is significant. In the 85th percentile, a 5.7 mph difference. In the 75th percentile, the gap grows to 6.8 mph. O’Neill’s 85th percentile ranked 16th among all hitters, while Sosa’s ranked 155th. But, somehow, Sosa’s max exit velocity was 1.5 mph higher than O’Neill’s. Sosa’s next hardest-hit batted ball was 108.2 mph. Outliers and misreads happen all the time. The Hawkeye system, while a great tool, is not perfect.
Using percentile exit velocity helps eliminate what you see with Sosa and O’Neill. It is uncertain if Sosa’s max batted ball was a misread or not, but the reality is, it is still his max, even though it should be taken with a grain of salt. Looking at different percentiles, such as 80th or 90th, gives you a better idea of which hitters hit the ball consistently hard.
Descriptiveness
Are max and average exit velocity helpful when looking at descriptiveness of power? We will use home runs per batted ball event percentage for this exercise. This is because exit velocity has a denominator of batted ball events. When looking at home runs, it is more helpful to look at it on a per batted ball event basis than just general home run percentage.
Data was tested for every hitter who received at least 250 plate appearances per season since 2015(when Statcast originated). All percentiles were run and compared to different batted ball metrics. As I previously mentioned, we will begin by looking at HR/BBE percentage.
Let’s first look at how max exit velocity and home runs per batted ball event percentage correlate. You often hear that max EV is a good descriptor of power potential. The R^2 of home runs per batted ball event to max ev comes out to .2909. This R^2 is extremely weak compared to other percentiles and average ev itself.

Average exit velocity is the other Statcast metric that is easy to find and quote. When looking at average EV and home runs, the average comes in with a much stronger R^2 of .3766. But how does it stack up with different percentiles?

80th percentile comes in just slightly ahead of 90th percentile exit velocity. The R^2 of the 90th percentile to HR/BBE% came in at .447 while 80th came in at .4681. As you will see moving forward in the article, 80th percentile tends to perform extremely well when looking at predicting and describing power. The charts below show how 90th and 80th percentile stack up with HR/BBE%, but what about other stats?


The table below shows the R^2 between average and max ev and 80th and 90th percentile(the two percentiles with the strongest correlation) and different metrics. You can throw out any relation between exit velocity and batting average.
Exit velocity helps describes wRC+ and wOBA, but the strongest R^2 comes with power metrics, such as home runs per batted ball event and ISO.
| AVG EV | 80th Percentile | 90th Percentile | Max EV | |
|---|---|---|---|---|
| HR/BBE% | 0.3766 | 0.4681 | 0.447 | 0.2909 |
| ISO | 0.3756 | 0.4289 | 0.3998 | 0.2702 |
| wRC+ | 0.2646 | 0.2289 | 0.1893 | 0.1369 |
| wOBA | 0.2523 | 0.2225 | 0.1848 | 0.1332 |
| BABIP | 0.0113 | 0.0099 | 0.0055 | 0.0034 |
You can gather from the data that when looking for the strongest R^2 of power metrics, 80th percentile EV is the most useful. What if we could take it a step further and not just look at all batted balls? You have often heard of looking at average exit velocity on fly balls, but how do the percentile exit velocities measure up?
What about Fly Balls?
We have established that using 80th percentile exit velocity seems to be the best descriptor of home run power. But what if we use fly balls. 
The chart above shows that using average fly ball exit velocity makes the R^2 much stronger with HR/BBE percentage. That number only increases when using 80th and 90th percentile ev on fly balls. Max exit velocity does not appear helpful here with a much lower R^2 than average, 80th, and 90th percentile.
Naturally, you would think that fly ball exit velocity and home run per fly ball rate strongly correlate. That is proven true, as you can see in the chart below.
| AVG | 80th | 90th | Max | |
|---|---|---|---|---|
| HR/BBE% | 0.6077 | 0.6336 | 0.6152 | 0.4102 |
| HR/FB% | 0.6292 | 0.6706 | 0.6509 | 0.4202 |
We have now seen how using 80th percentile exit velocity on both all batted balls and fly balls only may be helpful to help describe a player’s power output, but what about its predictiveness?
Predictiveness
Can we use 80th or any other percentile of exit velocity to predict future power output? Using data from 2015 through 2021, I ran the data looking at the previous seasons’ exit velocities against the next season’s power outputs. The results are below.
| AVG EV | 60th | 70th | 80th | 90th | Max EV | |
|---|---|---|---|---|---|---|
| HR/BBE% | 0.3025 | 0.3288 | 0.3561 | 0.3657 | 0.3624 | 0.2628 |
| HR/FB% | 0.3457 | 0.3713 | 0.4094 | 0.4204 | 0.4215 | 0.3155 |
| ISO | 0.2485 | 0.2563 | 0.2784 | 0.2833 | 0.278 | 0.2148 |
80th percentile exit velocity tested extremely well when looking at the same years’ descriptiveness of power output, and it stands up here when looking at future power output. 80th percentile exit velocity had the strongest R^2 with future home runs per batted ball events. 90th percentile squeaked by 80th when looking at the predictability of future home run per fly ball percentage. But, in general, you see 80th percentile exit velocity being the strongest predictor of future power output.

It is somewhat surprising to see max exit velocity perform the worst of any percentile tested. As I mentioned earlier in the article, it shows that you often see misreads or significant outliers, as I pointed out with Edmundo Sosa.
80th percentile exit velocity has consistently passed the test(barely ahead of 90th) when testing it against the data. Every 5th percentile was tested, and the 80th percentile had the strongest R^2 with nearly every power metric except 90th percentile ev coming out slightly ahead when looking at the predictability of home run per fly ball rate.
80th Percentile Exit Velocity Standouts
The usual suspects top the leaderboard for the 80th percentile. Giancarlo Stanton, Vladimir Guerrero Jr., Aaron Judge, Ronald Acuña Jr., and Mike Trout are the top five for 2021. Some names that catch my eye, however, are Byron Buxton, who ranks 11th, Garrett Cooper (15th), Jorge Alfaro (16th), Mitch Garver (19th), and Brad Miller (32rd).
Differentials in Average and 80th Percentile Exit Velocity
| Player | AVG | 80th | AVG Rank | 80th Rank | Difference |
|---|---|---|---|---|---|
| Frank Schwindel | 86.94 | 102.1 | 278 | 120 | 158 |
| Pedro Severino | 88.24 | 103.6 | 216 | 61 | 155 |
| Jonathan Schoop | 88.14 | 102.5 | 223 | 102 | 121 |
| Jo Adell | 86.20 | 101.06 | 299 | 179 | 120 |
| Elias Diaz | 87.12 | 101.62 | 269 | 149 | 120 |
| Ramon Laureano | 87.95 | 102.1 | 234 | 120 | 114 |
| Travis Shaw | 87.69 | 101.9 | 246 | 133 | 113 |
| Bobby Bradley | 89.02 | 103.58 | 175 | 62 | 113 |
| Trey Mancini | 88.92 | 103.38 | 181 | 70 | 111 |
| Starling Marte | 87.56 | 101.72 | 251 | 145 | 106 |
| Willi Castro | 85.63 | 100.56 | 311 | 205 | 106 |
| Jonathan Villar | 87.95 | 101.98 | 233 | 128 | 105 |
| Pavin Smith | 87.19 | 101.38 | 265 | 165 | 100 |
When looking at the hitters with the most significant differential’s between average EV and 80th percentile, we see Frank Schwindel and Pedro Severino top the list. Others who stand out that make the list are Jo Adell, Starling Marte, and Jonathan Villar.
Differentials in Average and 80th Percentile Exit Velocity
| Player | AVG | 80th | AVG Rank | 80th Rank | Difference |
|---|---|---|---|---|---|
| Justin Turner | 90.94 | 100.3 | 65 | 215 | -150 |
| Mookie Betts | 90.32 | 99.82 | 87 | 234 | -147 |
| Josh VanMeter | 89.33 | 98.5 | 159 | 284 | -125 |
| Enrique Hernandez | 90.78 | 100.82 | 71 | 195 | -124 |
| Chas McCormick | 90.31 | 100.38 | 89 | 211 | -122 |
| Ozzie Albies | 89.62 | 99.3 | 138 | 256 | -118 |
| Andrew Benintendi | 89.58 | 99.4 | 143 | 250 | -107 |
| Luis Arraez | 88.44 | 97.1 | 207 | 314 | -107 |
| Will Smith | 90.12 | 100.64 | 99 | 203 | -104 |
| Adalberto Mondesi | 92.26 | 101.94 | 29 | 129 | -100 |
| LaMonte Wade Jr. | 90.13 | 100.8 | 98 | 196 | -98 |
| Kyle Tucker | 91.44 | 101.84 | 42 | 138 | -96 |
When we look at the hitters with the most significant negative differentials in average exit velocity and 80th percentile, some big names show up. Justin Turner is the first name on the list. He has a solid average EV above 90 mph, but his 80th percentile exit velocity ranked 215 of 328 hitters.
Mookie Betts is another one who catches my eye. He had a down season last year dealing with injuries, but it slightly concerns me that his 80th percentile ev ranked 234 among all hitters.
Ozzie Albies is another name who cracks the list. Albies does not hit the ball extremely hard, despite posting a 30 home run season last year. His 80th percentile exit velocity ranked 256 out of 328 hitters last season.
Finally, Kyle Tucker posted a strong average exit velocity that ranked 42nd and 85th percentile among all hitters. His 80th percentile EV does not rank nearly as low as Betts or Albies, but he ranks 96 spots lower than his average EV rank.
Fantasy Baseball Usefulness
There are many tools that you should use for your Fantasy Baseball research. Using the database is not something that gives you all the answers, much like Statcast metrics in general. Knowing how to use these numbers will help make you a better player. Research shows that using the 80th or 90th percentile is more valuable than average or max EV. The reality is that max exit velocity does not tell us much about power output. It is a fun stat to quote, but it is pretty noisy.
Using the 80th percentile should not be absolute in your research, much like anything we discuss. Yes, using these exit velocities as a predictive measure can be helpful, but it is not an end-all-be-all to future power. Kyle Tucker, Ozzie Albies, and Mookie Betts will still hit plenty of home runs in 2022.
I hope you will find this helpful, and you can always refer to the exit velocity database to see where hitters rank for specific percentiles. I will update the data weekly during the season so you can follow along with where your hitters rank!
Thanks for reading, and happy 2022 MLB season! Be sure to check out all our other great fantasy baseball content at FantraxHQ.