
Over the course of this never-ending offseason, I have debuted a series of pieces about pitchers and various plate discipline metrics. When I originally set out on the project, the goal was to actually evaluate hitters. The inspiration for the research was Cavan Biggio, a hitter who is regarded to have elite plate discipline due to his extremely passive approach at the plate. He rarely swings at pitches out of the zone but he also rarely swings at all. His out of zone swing rate was second-lowest among hitters with over 100 PAs, but his overall swing rate was 1oth lowest among all hitters in that same sample.
So while he does not swing out of the zone often, he also does not swing often, to begin with. This begs the question is he passive or is he really good at identifying pitches. One of the popular and powerful plate discipline evaluations is Zone Swing minus Out Of Zone Swing rate.
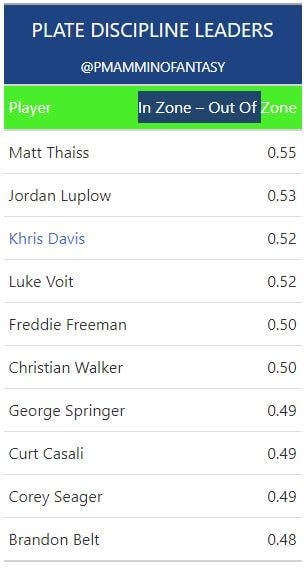
Above are the leaders, min 100 PAs for the 2019 season in this metric. This means that Thaiss has a swing rate on pitches within the zone that is 55% higher than his out of zone swing rate. This would seem to indicate pretty good plate discipline. However, the question is, does this make Thaiss a better hitter? The metric within the 2019 sample had a correlation of 0.26 with wOBA. This is fairly strong for real-world observations and means that this is significant, but is not extremely significant.
Building A Better Plate Discipline Metric
I wanted to find a better way to evaluate the decisions that hitters make. It is extremely difficult to compare hitters as each one is pitched much differently. Thaiss will see completely different pitches in different zones than a guy like Khris Davis or Freddie Freeman. Additionally, I was not a fan of the binary In-Zone vs Out-Of-Zone concept.
Breaking the Binary Approach
In traditional plate discipline models, hitters are penalized for taking pitches within the zone but based on the count, pitch type, and location the decision to swing might not actually be a good one.
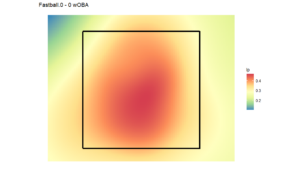
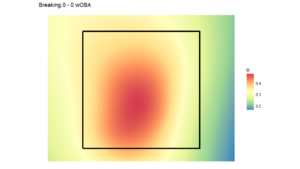
For example, take the above two charts, which underly the entire premise of the model. In the first chart, we see an expected wOBACon based on location for fastballs thrown in a 0-0 count. However, the second chart shows the expectation for Breaking pitches thrown in that same count. The hot zone for the fastball is much larger than the Breaking, so in a 0-0 count why would we give a hitter credit for swinging at a breaking ball with a lower expected wOBA value. Additionally, a fastball just outside of the zone has a lower expected value than a breaking ball in the same location.
For each pitch grouping and count combination, I have generated charts similar to the two examples I showed above. These charts are completely hitter/pitcher independent and are focused entirely on location. These different models are trained using all balls in play since 2015 or the Statcast Era. This then allows me to generate an expected wOBACon for each pitch thrown over the course of a season.
This is the same concept that underlies the StuffERA models that I have built and discussed extensively for pitchers and have further developed for xWhiffs and xSwing. However, in the process of developing the hitting metrics, I made a small modification to the wOBA model that has caused some adjustments to the StuffERA results. I’ll be writing up an update to that as well soon.
Accounting For Approach
I ran the model on every pitch thrown in the MLB last season and each pitch was given a singular expected value. This allowed me to decipher how certain hitters were pitched. Let’s work at the extremes, overall the average expected wOBA value for pitches thrown to Aristedes Aquino was 0.314 the lowest in the sample for 2019. On the flip side, Tommy LaStella was not treated as cautiously as other hitters leading the league with a 0.3477 expectation. Similarly, low power hitters like Nicky Lopez and J.P. Crawford also top this end of the list. Similarly, Javy Baez and Eloy Jiminez find themselves on the other end of the list.
There are a number of reasons why pitchers would take this cautious approach with hitters. One could be an overall fear as pitchers would be much more willing to attack hitters they perceive as weaker. However, on the other hand, pitchers may also throw more pitches with a lower wOBA expectation to hitters that they believe will be more likely to chase. Regardless of the reasoning, we can see that when evaluating different hitters and their plate discipline abilities we need to account for how pitchers attack them.
Plate Discipline Score
This long and in-depth explanation has all been leading up to my various different attempts to improve upon our understanding of hitters and plate discipline skills. I have posted a few of these ideas to Twitter, and after some feedback from others finally settled on this final approach. Overall, in my opinion, plate discipline is based entirely on choosing the correct pitches to swing at. While it seems like a simple concept what exactly does that mean?
Based on the various things I have discussed previously, this needed to factor in a number of things. Based on the wOBA model I can determine the expected wOBA value for every pitch a hitter decided to swing at. This is a great approach and shows us a number of hitters who are generally considered to have elite plate discipline. Biggio comes in at second in this ranking.
However, there is a major flaw in this approach. This only factors in the pitches a given hitter chooses to swing at. Hypothetically, if every pitch saw by a given hitter was a fastball down the middle but he only swung at half of them, he would rank highly in xwOBA on swings. Yet I personally would not consider him to have elite plate discipline. So to account for how a given hitter was pitched, needed to also account for his takes.
I tried a number of different ways to factor this in but after some trial and error, I decided to compare a given hitter’s swings to all of his pitches seen. In order to do this, I wanted to see the difference between the xwOBA of the pitches he swung at versus all of the pitches he saw.
To best visualize this I took xwOBA_Swings divided by xwOBA_All and multiplied this value by 100. This makes it easy to interpret as it shows the percent increase in expected values for swings compared to all pitches. For example, a value of 110 means that a given hitter swung at pitches with a 10% higher expected wOBA value compared to all pitches that he saw.
Below are the top ten hitters for the 2019 season by this new metric.
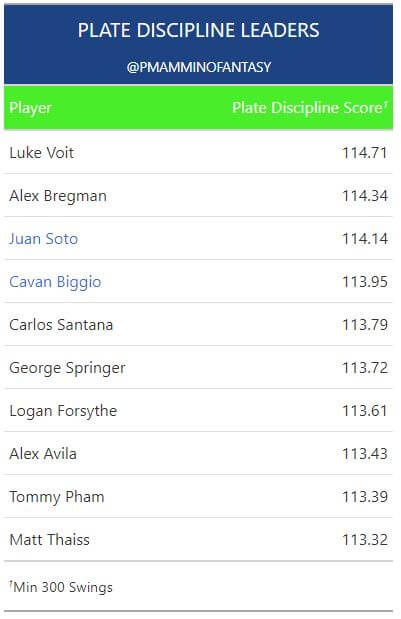
Looking over the list it passes the smell test. Hitters that appear near the top of the board are hitters that we would expect to see on a list of hitters with elite plate discipline. Juan Soto is regarded as one of the best in baseball at this. We also see Cavan Biggio rank highly which means that his passive approach is supported by the metrics.
Comparing this to the In-Zone minus Out-Of-Zone metric we seem some cross over at the top. However, my new Plate Discipline Score metric better correlates with actual hitter wOBA than the other metric. In the 2019 sample, the correlation was 0.36 which shows improvement. This seems to do a better job of parsing through swing decisions and how they impact overall ability.
Conclusion
I think that there are still improvements to be made but overall I believe that this is a step in the right direction when it comes to understanding how plate discipline truly works. There are a number of factors that impact a given hitter’s decision to swing and I think that I have started to account for them when creating an overall plate discipline metric. I will be expanding upon this more in the future but for the time being reach out to me on Twitter or in the comments to ask about your favorite hitter.