
Best ball season is in full effect! Analysts are putting up their early rankings. Our favorite experts are piling into draft lobbies to get a feel for positional value. All the while, we the people sit back, look at the completed mocks, and immediately provide our own analysis:
“Drew Brees in the 15th round? Lol!!! Not in my league.”
“You totally overspent on Lamar Miller, bro.”
“Wow… these are all players that I personally wouldn’t draft…”
Despite the crippling guilt, I’m convinced each analyst suffers after receiving such tweets. What if you could be the people’s savior? What if there was a way you could match wits against these so-called experts? You could show them. For $10, I’ll show you a way to take them down. Allow me to introduce you to Fantrax’s Best Ball Leagues.
What Is Best Ball?
Best ball leagues calculate your roster’s highest weekly score based on the players available. Simply put, it removes the guesswork. No more sweating Drew Brees’ defensive matchup. No more screaming at your pants because Tyrell Williams just laid a 2/15/0 stat line. The site has already found your best players of the week, tallied your score, and adjusted your rank within the league. Relax. You don’t have to tilt anymore.
Scores are calculated using the full point PPR format. Weekly results are calculated and totaled over the full NFL season. The team with the most total points at the end of the regular season is the winner. Payouts vary depending on the league structure and have expanded from paying out 1-2 winners to the top half of the league.
The “set it and forget” nature of best ball leagues offers a lot of convenience to those new to fantasy. It removes the weekly waiver wire commitment that can become like a job as the fantasy season drags on. Even the draft itself can be done at your leisure. Best ball formats offer multi-hour timers that give drafters a buffer for researching average draft position (ADP) trends or digesting breaking news. But, conversely, the lack of a waiver wire eliminates your ability to adjust if you’ve made a pick after news breaks. For those who drafted Mark Ingram before this, thoughts and prayers. In this situation when one of your players will be out for some time, the remaining players will have to compensate.
Rosters
Weekly starting rosters on Fantrax consist of the following positions:
- 1 – Quarterback
- 1 – Tight End
- 2 – Running Backs
- 3 – Wide Receivers
- 1 – Flex (RB, WR, or TE)
- 1 – Defense/Special Teams
That’s eight starting positions for 12 owners drafting 20 rounds. Bye weeks, injury concerns, and week to week volatility bring about the discussion of roster construction and draft strategy. Each debate seeks to unlock the magical combination of players, position, draft position and ADP value that wins you your league. Whether it be Zero RB, Zero WR, or Modified Zero RB, the strategies give you a template on how to approach your draft, players to target, and how your final roster should look. Regardless of which strategy you use, it’s critical to understand the power of draft capital and how it can give you an edge in drafts.
An Example
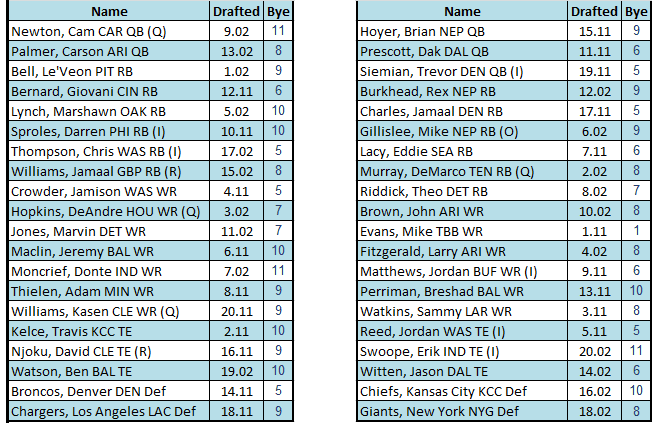
Roster Construction
These rosters were from the same league drafted during April 2017. The left roster won the league, and we’ll highlight some of the reasons this was possible. There are some big names on each roster, but let’s take a step back to better understand why one route is more optimal than the other. Let’s start with roster construction.
Roster A: 2/6/7/3/2
Roster B: 3/6/6/3/2
The numbers correspond to the amount of players drafted at their respective positions (QB/RB/WR/TE/DEF). The rosters appear similar at first glance, but a closer look reveals a flaw in Roster B’s approach. You typically start one QB, TE (unless you Flex two), and DEF negating the need for multiple assets at the position. The additional picks allow you to invest in other positions with higher variance or injury rates reducing your overall risk. Mike Beers (@beerswater) of the BestBall Command Center observed roster construction win rates over the course of the season with the following results:
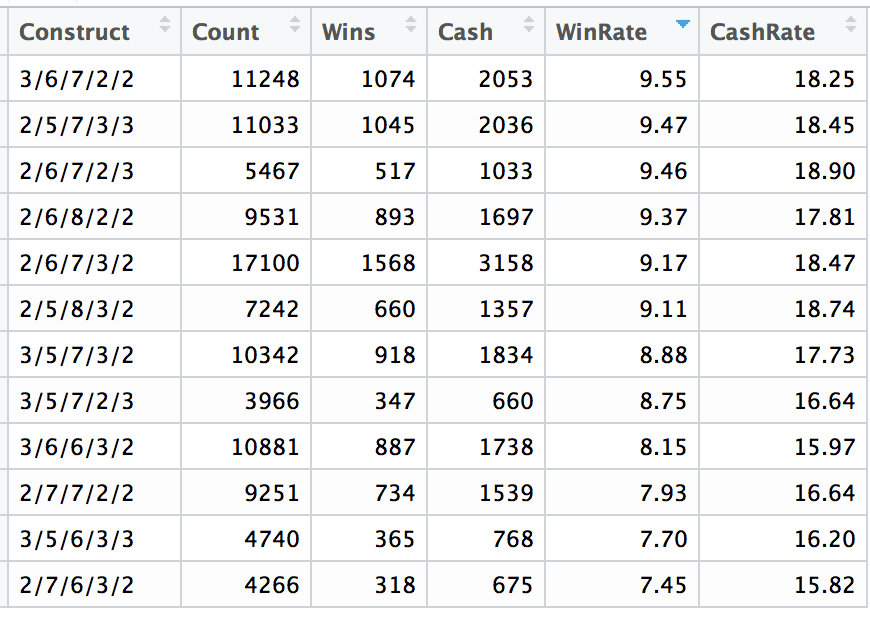
The chart highlights the fact that just the number of players acquired at a position can affect your chances at winning. Roster A had a 9.17% chance on winning on roster construction alone versus Roster B’s 8.15% win rate. While the difference seems insignificant, the adage “less isn’t more” rings true. Six slots have been allocated to two single start positions (QB, TE). That leaves 20% of the roster unusable every week. The additional running back or receiver (receiver more advisable because of PPR scoring) provides more leverage as a single play can win a week. Overall, running backs and wide receivers are heavily emphasized in both rosters while limited capital is spent on the “onesie” positions. However, the amounts themselves are only part of the puzzle. The second piece is when the players are drafted.
Draft Position
Le’Veon Bell is in the elite tier of running backs and gets touches through the ground and passing game. Selecting Bell at 1.02 allowed Roster A to acquire wide receivers and an elite tight end, relying on Bell to pay off his draft price (i.e. meet/exceed seasonal projections). By supplementing Bell with other running backs with viable workloads, the risk of Bell not meeting his price could be reduced barring injury.
Contrast this approach with Roster B’s. The investments at running back in rounds 6-8 left little value at wide receiver. In addition to this, two of the three backs selected had workload concerns with no viability in the passing game providing even less value. With this example, it’s important to realize that roster construction, player situation, and draft capital all contribute to your total score.
As previously noted, there are no drastic numerical differences between the two constructions. The clear difference lies in the distribution of ADP across the positions and the projected workloads and offensive situations for the players drafted. If running backs and wide receivers accumulate the most points for our team, draft capital must be set aside for them to create a winning team. Beers’ chart points out that both strategy and construction must be considered in order to profit in best ball leagues.
2018 Trends
It’s important to know what to expect when you hop into drafts. After so many players leave the board, adjustments become necessary when assessing value in each pick. Trends across all drafts can help us decide what is optimal depending on our position.
After doing a few post-NFL Draft best-ball’s, one thing is apparent: RBs are flying off the board this year.
Number of RBs selected in the first three-rounds, by year:
2018 – 20 (55.6% of picks were RBs)
2017 – 17 (47.2%)
2016 – 14 (38.9%)
2015 – 15 (41.6%)
2014 – 17 (47.2%)— Graham Barfield (@GrahamBarfield) May 16, 2018
Poor quarterback play in 2017, regression at the wide receiver position, and a promising running back class have led to the trend displayed above. This makes repeating Roster A’s success much more difficult in 2018. However, this leaves talented receivers available in their place creating value at another position.
Rookies to Watch
The 2018 class brings a lot of intrigue, and many rookies have landed in situations viable for best ball. Running backs produce more earlier in their careers, which is why they carry the more expensive cost. Here are a few with their associated draft prices:
- Saquon Barkley (Mid-Late 1st Round): Barkley’s skills in both the running and passing game are just what the Giants needed. Their defense is in shambles, which should create positive game scripts for the rookie. He comes with a hefty price tag, but the other receiving options on the team and lack of competition for touches in the backfield make him a heavily contested pick in the first round.
- Royce Freeman (Early 5th Round): The departure of C.J. Anderson and Devontae Booker underwhelming in 2017 put Freeman in an advantageous spot for 2018. It’s unclear how much of the workload he’ll see, but Oregon’s zone blocking scheme (Freeman’s alma mater) matches more of what Gary Kubiak wants to see out of the offense. He is risky at his price, but the upside of taking the job makes the investment palatable for now.
- Michael Gallup (12th-14th Round): As of this writing, Gallup only needs to compete with Terrence Williams and, possibly, Allen Hurns for targets. Gallup’s college resume has the makings of a notable receiver, but the Cowboys’ offense is a bit of an enigma. The loss of their receiving talent creates a vacuum of 171 targets. Even a small percentage of these left over targets would pay off a late-round price for this talent receiver.
- Anthony Miller (13th-15th Round): Miller finds himself on one of the most hyped offenses coming into 2018. He’ll have a chance to play in the slot with defenses focusing on Allen Robinson on a Matt Nagy led offense. Matt Harmon, creator of Reception Perception, recently compared him to Doug Baldwin. His ADP is likely to rise as the summer continues. Now is the time to invest while he’s still going late.
Final Note
Many high volume drafters have preached and will continue to preach their winning draft strategy. When reviewing their rosters, some of the same players might pop up across multiple drafts. Analysts will have “Late Round Value” articles spotlighting the same players. The problem here is that if everyone thinks a specific player has value, then he really has none. A player can’t be a sleeper if drafters are #woke to his game. It’s here where strategy can break down as owners hunt for specific players to construct their rosters.
The underlying concepts to each strategy are what give them a logical foundation. The players performing to or exceeding their expectations are a welcomed bonus, but landing on the player based on process creates consistent decisions throughout all drafts. A deeper understanding of player value, their on-field talent, and situation is required, but this can be accomplished leveraging some of the many tools available in this area.