Based on the evolution of pitcher usage, the Quality Start (QS) is quickly becoming one of the most scarce resources in Fantasy Baseball. Over the last few seasons, many redraft and dynasty leagues are more commonly using Quality Starts as a reaction to the randomness of Wins.
Yet there is plenty of mystery around how exactly to make sense of the past, or accurately make predictions, about how a pitcher may earn Quality Starts. Whether you believe in the merits of the 6 IP, 3 ER statistic as a benchmark for success is another conversation. This deep dive into Quality Start data is meant to address some of those mysteries and help you strategize in your startup drafts or trade targets in order to build a winning team.
The data set used for this article was downloaded entirely from Fantrax. Please view or download the data set here for your reference or to make your own discoveries. I welcome continuing the conversation based on the analysis below.
If you aren’t playing your dynasty leagues on Fantrax, you’re missing out on the deepest player pool and most customization around. What are you waiting for? Start a league today!
Analyzing Quality Starts For Dynasty Leagues
First, it’s important to take a look at how the pitching landscape has evolved over the last few seasons.
| 2016 | 2017 | 2018 | 2019 | |
| No. Pitchers w/ at least 1/3 IP | 677 | 705 | 739 | 770 |
| No. Pitchers w/ at least 1 GS | 289 | 300 | 335 | 365 |
| No. Pitchers w/ at least 1 QS | 230 | 234 | 224 | 218 |
A few takeaways from the chart above:
- The number of pitchers recording at least one out has increased by 93 over the last four years, or a 13.7% increase. This is an average of about three more pitchers per team recording at least one out over a four year span.
- The number of pitchers starting games has increased by 76 over the last four years, or a 26.2% increase. This can be attributed to a number of factors, at least one of which is the use of the opener strategy beginning in 2018.
- The number of pitchers earning Quality Starts has decreased by a very small amount: only 5.2% over the last four years.
- The more drastic difference relating to Quality Starts is the percentage of pitchers to record at least one QS who started at least one game: 79.6 % in 2016 and 59.7% in 2019.
We haven’t traditionally had much in the way of determining what makes for an effective Quality Start pitcher for fantasy baseball. We certainly have plenty of logical inferences that we could make: things like IP, IP per start, low WHIP, etc. I have sought to create a couple of metrics that can help quantify, and even hopefully predict, how you can target specific pitchers for Quality Starts.
Quality Start Statistic Number 1: Number of Innings to Earn a QS (IP/QS)
I played with the numbers in Excel until something started to jump out. The first thing that stood out is what happened when I divided Innings Pitched (IP) by Quality Starts (QS). This ratio means how many innings does it take to earn a QS. This is a similar idea to At Bats per Home Run for hitters (AB/HR), which is how many AB does it take to hit a HR. It is better to have a lower IP/QS rate because it is more desirable to have a pitcher tally each QS in as few innings as possible.
Here are the Top 20 IP/QS Pitchers for the 2019 season (minimum 75 IP).
| Player | IP/QS | ADP (’20) |
| Frankie Montas | 8.00 | 84.09 |
| Clayton Kershaw | 8.10 | 33.2 |
| Gerrit Cole | 8.16 | 5.28 |
| Hyun Jin Ryu | 8.28 | 119.45 |
| Patrick Corbin | 8.42 | 32.7 |
| Justin Verlander | 8.58 | 20.08 |
| Zack Greinke | 8.68 | 52.87 |
| Jacob deGrom | 8.87 | 7.99 |
| Shane Bieber | 8.92 | 21.89 |
| Danny Duffy | 9.30 | 332.47 |
| Dallas Keuchel | 9.35 | 191.41 |
| Stephen Strasburg | 9.50 | 22.85 |
| Luis Castillo | 9.51 | 36.59 |
| Jose Berrios | 9.53 | 62.52 |
| Mike Soroka | 9.68 | 77.72 |
| Mike Clevinger | 9.69 | 36.59 |
| Mike Fiers | 9.69 | 291.41 |
| Jack Flaherty | 9.81 | 23.24 |
| Joe Musgrove | 10.01 | 197.59 |
| Max Scherzer | 10.12 | 14.02 |
A few takeaways from the chart above:
- Some of the top-rated starting pitchers by ADP yield the lowest IP/QS rates. Other pitchers who fell within the Top 20 range that didn’t meet the 75 IP threshold for this chart: Brock Burke (8.73), Matt Shoemaker (9.40), Aaron Civale (9.53), Rich Hill (9.70), and Sean Manaea (9.73).
- Other notable pitchers IP/QS rates inside the top 200 in ADP: Charlie Morton (21st, 10.22), Marcus Stroman (22nd, 10.23), Sonny Gray (24th, 10.30), Madison Bumgarner (26th, 10.36), Lucas Giolito (27th, 10.36), Lance Lynn (29th, 10.41), Luke Weaver (32nd, 10.68), Blake Snell (34th, 10.70) and Walker Buehler (35th, 10.71).
- Many veteran arms over 30 years old tended to be some of the top performers for IP/QS, making it a consideration for how you draft for QS in dynasty leagues.
If we were to use this statistic to predict QS for 2020 using 175 IP as a benchmark, the difference between the IP/QS rates for Frankie Montas and Walker Buehler equates to 21 QS (Montas) and 16 QS. This helps get a sense of the magnitude and how to use the statistic.
Here are some of the higher IP/QS rates from 2019 who are among the earliest pitchers drafted by ADP in 2020:
| Player | IP/QS |
| Tyler Glasnow | 12.04 |
| Brandon Woodruff | 12.12 |
| Eduardo Rodriguez | 12.69 |
| Mike Minor | 13.01 |
| Matthew Boyd | 13.22 |
| Chris Paddack | 14.02 |
| Robbie Ray | 15.83 |
| Zac Gallen | 16 |
| Yu Darvish | 16.2 |
- As a matter of perspective, Yu Darvish (16.2 IP/QS) had to throw more than twice as many innings as IP/QS leader Frankie Montas (8.0 IP/QS) to earn just one Quality Start. Considering the discrepancy in Fantrax ADP of Darvish at 61.3 and Montas at 84.1, Montas is a relative QS bargain compared to Darvish.
- Youth/service time impacts the IP/QS ratio negatively. Rookie pitchers like Chris Paddack and Zac Gallen were used more conservatively than their veteran counterparts. This would raise the IP/QS ratio. In other words, it generally would take a rookie pitcher more innings to accumulate each QS.
- Higher WHIP seems to impact IP/QS. Higher WHIP pitchers such as Eduardo Rodriguez (1.33) and Robbie Ray (1.34) tend to also have a higher IP/QS rate than other high K pitchers. This would make logical sense, as higher pitch counts and/or more traffic on the bases would decrease the likelihood that a pitcher earn a QS.
What is the Scale of IP/QS?
The definition of a QS is pitching six IP allowing three or fewer runs. Therefore, the start of the IP/QS scale is six. For example, a pitcher that throws exactly six IP and records one QS will have an IP/QS ratio of six.
Numbers in the sample ranged from 8.0 IP/QS (Frankie Montas) to 121.1 IP/QS (Wade LeBlanc) in 2019. LeBlanc started 1 of 8 appearances he made in 2019, so he recorded one QS in his 121.1 IP of work. Similarly, Drew Pomeranz had 104 IP/QS, because even though he started 18 G, he recorded one QS in his 104 total IP (he also ended up in the bullpen midseason). It’s important to realize that pitchers like LeBlanc and Pomeranz will have very high IP/QS because they are not a traditional, SP1-SP5 rotation arm.
Doing a break down of GS%, there’s too many statistical anomalies to make hard rules for GS% bands (for example, GS% 90-100, 80-89, 70-79, etc). For example, Mitch Keller started 100% of his appearances in 2019 yet had an IP/QS of 48 (it took 48 IP to earn his 1 QS), while Jose Ureña started 54% of his games and had a QS/IP of 10.5.
Generally speaking though, pitchers that start less than 80% of their games tend to post significantly higher IP/QS figures (exceptions to this discussed below).
To learn more about IP/QS behaves, it’s easier to handpick some examples and examine each individual case.
| Player | IP/QS | START % |
| Yonny Chirinos | 13.31 | 69.23 |
| Kenta Maeda | 17.02 | 70.27 |
| Dinelson Lamet | 18.25 | 100.00 |
| Andrew Heaney | 23.78 | 100.00 |
| Dylan Cease | 24.33 | 100.00 |
A few takeaways from the chart above:
- Veterans such as Dinelson Lamet (129th ranked IP/QS) and Andrew Heaney (161st ranked IP/QS) do not justify their ADP (123, 179 respectively) as it pertains to IP/QS.
- Talented multi-inning relievers/6th starters such as Yonny Chirinos and Kenta Maeda earn QS at a strong rate while starting in about 70% of their outings. Given the opportunity to start at above 90% would vault both up the IP/QS rankings.
- Dylan Cease was a significant data point in the sample because he represented the highest IP/QS rate among pitchers who started 100% of their outings and have an ADP inside of 250.
IP/QS Graphically
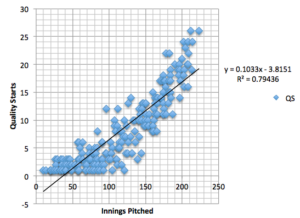
Compiling the data graphically, it reveals some interesting information.
- There is a positive relationship between innings pitched and quality starts. As pitchers throw more innings, expect Quality Starts to increase.
- There appears to be a relatively strong positive correlation (R^2 value =0.79) between IP and QS. R^2 values range between 0 (no correlation, completely random) and 1 (perfect correlation, completely linear).
- The strength of the positive correlation suggests that the trend line has some statistical meaning.
- It is important to consider why there isn’t a perfect correlation. As far as earning QS, not all innings are equal for calculating QS. For example, if a pitcher earns a QS by throwing exactly 6 IP, this is equivalent as a pitcher throwing a 9 IP shutout by QS standards. Both starts equate to 1 QS. Plus, you can’t take those three innings at the end of the shut out and apply them to another QS.
- Further, not every inning a pitcher throws is eligible to be counted towards a Quality Start: 113 of 218 pitchers (51.8%) sampled started 100% of their outings (even Clayton Kershaw and Shane Bieber had relief appearances in 2019).
- These points helps explain why IP per start actually is not the most helpful for determining QS data. Let’s consider Mike Minor as an example. He was 2nd behind Justin Verlander (6.56) in IP/GS at 6.5. However, Minor was ranked 33rd in QS with 16.
I looked at data samples from 2016-2019 and created four similar graphs. Here are the trend line equations for each season graphically between 2016-2019.
| Year | Trend Line Equation | R^2 Value |
| 2019 | QS= 0.1033(IP) – 3.8151 | 0.79 |
| 2018 | QS= 0.104(IP) – 3.2108 | 0.82 |
| 2017 | QS= 0.1002(IP) – 2.4021 | 0.85 |
| 2016 | QS=0.1078(IP) – 3.247 | 0.86 |
Over the four years of data, the trend lines were remarkably similar (pictured below). The strength of the correlation (R^2 value) has gone down slightly over the last four years but remains relatively strong.
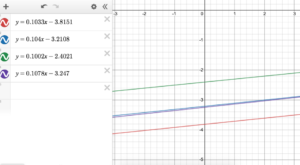
Graph created using desmos.com/calculator
We could generalize a league average equation using trend line averages from the last four years to get the equation:
QS = 0.1 (IP) – 3
Take any IP, multiply it by 0.1 (or divide by 10), and subtract by 3 to get the expected number of QS. For example, using 180 IP, we would expect, on average across the league, a pitcher to generate 15 QS.
The trend line equation above has a few very important applications:
- It has a predictive nature that you can input IP values (x) and generate expected QS (y) values. This is a league-average equation used for all pitchers to earn a QS in a given season.
- Each point is a certain distance from the trend line, meaning that pitchers earn QS above or below the league average rate given a certain number of innings. This leads us ahead to the second QS metric.
Quality Start Statistic Number 2: Actual QS- Expected QS
Using the trend line above, you can examine how pitchers differ from the league average based on the number of IP.
What you are measuring mathematically is the distance from the trend line. The distance above the trend line means that some pitchers outperform their expected QS (above the line given number of IP). The distance below the trend line means that some pitchers underperform their expected QS (below the line given number of IP).
It also measure degree, meaning that some pitchers are far from the line or close to the line in either direction. The math is simple to calculate the degree: Actual QS – Expected QS.
- Take the number of IP that a pitcher threw in a given year and plug that value into the trend line equation QS = 0.1 (IP) – 3. This generates the Expected QS value.
- Subtract the number of actual QS that a pitcher threw from the Expected QS value.
- Positive/Negative: If the number is positive, the pitcher is above the league average for earning QS. If the number is negative, the pitcher is below the expected league average for earning QS.
- Large/Small: If the number is close to 0, the pitcher is closer to the league average Expected QS. If the number is further from 0, the pitcher is further from league average Expected QS.
Here is an assortment of nearly 40 pitchers using 2019 data, sorted by descending QS-ExQS.
| Player | IP | QS in 2019 | Expected QS | QS-ExQS | IP/QS |
| Gerrit Cole | 212.1 | 26 | 18.21 | 7.79 | 8.16 |
| Clayton Kershaw | 178.1 | 22 | 14.81 | 7.19 | 8.10 |
| Patrick Corbin | 202 | 24 | 17.2 | 6.8 | 8.42 |
| Hyun Jin Ryu | 182.2 | 22 | 15.22 | 6.78 | 8.28 |
| Justin Verlander | 223 | 26 | 19.3 | 6.7 | 8.58 |
| Zack Greinke | 208.2 | 24 | 17.82 | 6.18 | 8.68 |
| Jacob deGrom | 204 | 23 | 17.4 | 5.6 | 8.87 |
| Shane Bieber | 214.1 | 24 | 18.41 | 5.59 | 8.92 |
| Frankie Montas | 96 | 12 | 6.6 | 5.4 | 8.00 |
| Stephen Strasburg | 209 | 22 | 17.9 | 4.1 | 9.50 |
| Jose Berrios | 200.1 | 21 | 17.01 | 3.99 | 9.53 |
| Danny Duffy | 130.2 | 14 | 10.02 | 3.98 | 9.30 |
| Luis Castillo | 190.2 | 20 | 16.02 | 3.98 | 9.51 |
| Dallas Keuchel | 112.2 | 12 | 8.22 | 3.78 | 9.35 |
| Mike Soroka | 174.2 | 18 | 14.42 | 3.58 | 9.68 |
| Mike Fiers | 184.2 | 19 | 15.42 | 3.58 | 9.69 |
| Mike Clevinger | 126 | 13 | 9.6 | 3.4 | 9.69 |
| Jack Flaherty | 196.1 | 20 | 16.61 | 3.39 | 9.81 |
| Joe Musgrove | 170.1 | 17 | 14.01 | 2.99 | 10.01 |
| Max Scherzer | 172.1 | 17 | 14.21 | 2.79 | 10.12 |
| Kyle Hendricks | 177 | 16 | 14.7 | 1.3 | 11.06 |
| Trevor Bauer | 213 | 19 | 18.3 | 0.7 | 11.21 |
| Max Fried | 165.2 | 14 | 13.52 | 0.48 | 11.80 |
| Zac Gallen | 80 | 5 | 5 | 0 | 16.00 |
| Griffin Canning | 90.1 | 6 | 6.01 | -0.01 | 15.02 |
| Chris Paddack | 140.2 | 10 | 11.02 | -1.02 | 14.02 |
| Rick Porcello | 174.1 | 13 | 14.41 | -1.41 | 13.39 |
| Caleb Smith | 153.1 | 10 | 12.31 | -2.31 | 15.31 |
| Joey Lucchesi | 163.2 | 11 | 13.32 | -2.32 | 14.84 |
| Andrew Heaney | 95.1 | 4 | 6.51 | -2.51 | 23.78 |
| Robbie Ray | 174.1 | 11 | 14.41 | -3.41 | 15.83 |
| Yu Darvish | 178.2 | 11 | 14.82 | -3.82 | 16.20 |
| Jake Odorizzi | 159 | 9 | 12.9 | -3.9 | 17.67 |
| Julio Urias | 79.2 | 1 | 4.92 | -3.92 | 79.20 |
| Kyle Gibson | 160 | 9 | 13 | -4 | 17.78 |
| Ryan Yarbrough | 141.2 | 7 | 11.12 | -4.12 | 20.17 |
| Ivan Nova | 187 | 11 | 15.7 | -4.7 | 17.00 |
| J.A. Happ | 161.1 | 8 | 13.11 | -5.11 | 20.14 |
A few takeaways from the chart above:
- The leaderboard for QS-ExQS is similar to the IP/QS leaderboard. As an example, the statistic means that Gerrit Cole, given the number of IP he threw in 2019, earned 7.79 more QS than a league-average pitcher who threw the same number of innings. It helps quantify exactly how much better a pitcher is at earning QS than the league average.
- There is a clear gap right between Frankie Montas (5.4) and Stephen Strasburg (4.1). I hand-picked much of the bottom of the list to examine points below, but a gap of 1.3 QS-ExQS for consecutively ranked players was noticeable. This could be a possible separator to help determine elite QS-ExQS performers.
- Innings eater types such as Kyle Hendricks (1.3) and Rick Porcello (-1.41) performed closer to 0 (league average). A pitcher such as Ivan Nova, who you likely would be drafting almost exclusively for QS in deep leagues, actually scored nearly 5 full ExQS below (-4.7) his actual QS given how many innings he threw (187).
- I have to highlight Zac Gallen here, who is exactly 0 QS-ExQS, meaning he pitched at exactly the league average expected QS rate given the number of innings he threw in 2019.
- Zac Gallen highlights why it is useful to consider both IP/QS together with QS-ExQS. As I discussed earlier, Zac Gallen has a higher IP/QS rate as a rookie pitcher but a league average QS-ExQS. This could possibly mean that Gallen could be a viable play for QS as he gains service time. You would expect that his IP/QS rate to go down, which should push his data point in QS-ExQS further away from the graph as time goes on.
Final Thoughts
There is still so much work to be done with studying Quality Starts. If you have any ideas, comments, please reach out to me via Twitter @TBDubbs11 or by email at [email protected]. If you would like to examine the data set, please follow the link here. Let’s keep the conversation going about this work so that we can make it grow: this is only the beginning!
Ben Wilson is a member of the FantraxHQ team as a Minor League Prospect Analyst and Dynasty Fantasy Baseball writer. Ben’s work can also be found on Prospects1500.com and formerly on Real McCoy Minors News. Ben is also a member of the Internet Baseball Writers Association of America (IBWAA). For more content from Ben, follow him on Twitter @TBDubbs11.

Fantrax was one of the fastest-growing fantasy sites of 2019, and we’re not letting our foot off the pedal now! With multi-team trades, designated commissioner/league managers, and drag/drop easy click methods, Fantrax is sure to excite the serious fantasy sports fan – sign up now for a free year at Fantrax.com.