I publish a regular article titled “Statcast Standouts” during the regular season. You can find those articles here if you are interested. In each of those articles, I break down players who stand out based on statcast data from Baseball Savant. I try to explain why each stat discussed in those articles was practical and helpful for Fantasy Baseball analysis.
It is now the offseason; player evaluations for 2022 have begun. Baseball Savant and Fangraphs are both likely a resource you use when evaluating players. You may see stats on those websites that you do not know what they mean. This article series has the intention to help you learn more about specific statcast data and other stats and how you can use that data to analyze players for Fantasy Baseball. It is important to note that a player’s statcast profile does not paint the entire picture. It is just another tool in the toolshed. So, let’s look at a couple of stats and how they are practical for Fantasy Baseball.
Part 1: Exit Velocity and Hard-Hit Rate
Statcast Metrics and How to Use Them
Barrel Rate

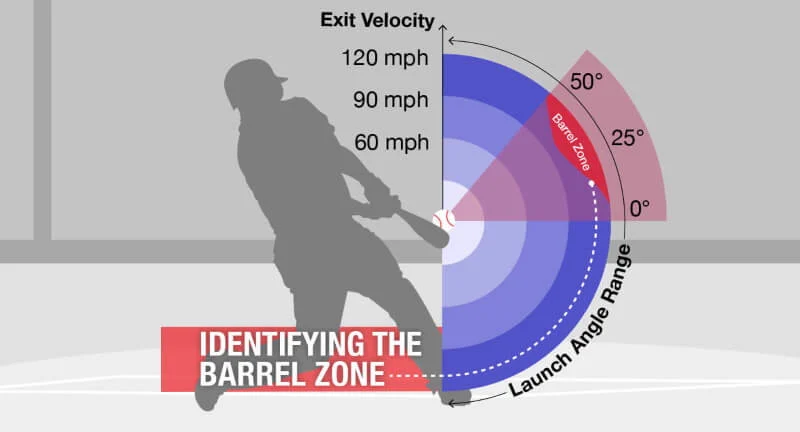
A barrel is a batted ball with similar hit types in exit velocity and a launch angle that has led to a minimum .500 batting average and 1.500 slugging percentage. The batted ball requires an exit velocity of 98 miles per hour to be barreled. As the exit velocity increases, the launch angle classified as a barrel also increases, as you can see in the chart above. The launch angle range grows two to three degrees for every one mph increase on the batted ball. Once a batted ball reaches 116 mph exit velocity, a barrel is assigned if the launch angle is between eight and 50 degrees.
Why is this important? In 2021, barreled balls had a .772 batting average! On top of that, barrels also produced a 2.591 slugging percentage and a 1.342 wOBA. Barrel rate has an extremely high correlation with home run rate ISO(isolated power equals slugging percentage minus batting average). Barrel rate is also the most predictive power metric.
A player with a 15 percent barrel rate or higher is considered elite when looking at a hitter’s profile. Anything between ten and 15 percent is considered good, while six to nine percent is average. Last season, 84.9 percent of home runs were barrels. On the flip side, 61.7 percent of all barrels were home runs. Very strong correlation there.
Fantasy Implication:
If you want to project a player’s future power output, look no further than barrel percentage. It is the strongest predictive statcast measure when forecasting future home runs. If you look on the Baseball Savant leaderboard, a barrel is classified as “Brls/BBE %.” You can also search by barrels per plate appearance which I find helpful.
I have attached the 2021 leaderboard for barrel rate below. It should not be a surprise to see all your typical power hitters show up here on the list.

Barrels trivia for today. Only one player who accumulated at least 250 plate appearances last season did not have a single barrel. Can you name that player? If you guessed David Fletcher, you are correct. Fletcher had 665 plate appearances last season without a barrel.
Launch Angle
Launch angle is the angle that a batted ball leaves a player’s bat. A player’s average launch angle is calculated by dividing the sum of all launch angles by all batted balls. The launch angle revolution has taken the league by storm, with players trying to achieve optimal launch angles. What is the optimal launch angle? Ideally, somewhere close to 15 degrees.
Average launch angle is not an excellent tool for evaluating a hitter. It can be more valuable when discussing pitchers, but we will get to that next week. A hitter’s launch angle can tell us about a hitter’s tendencies, though. If the player has a high launch angle, they may be a fly ball hitter. On the flip side, if a player has a low launch angle, like Raimel Tapia, they are likely to be a groundball heavy hitter. Tapia had an unusual, negative 4.4-degree launch angle, which led to a 68 percent ground ball rate. For those wondering, a negative launch angle is never good!
Fantasy Implication:
One reason average launch angle is not always a telling stat is that it is just an average. A player could have a high ground ball and fly ball percentage, which leads to a solid launch angle. Jorge Soler is an excellent example of this. His average launch angles over the last three seasons are 15.5, 15.5, and 15.7. A quick look at his batted ball chart by year will tell you his distribution was a little different.

While average launch angle may not always paint the best picture, this next stat will. Let’s take a look at the sweet spot percentage.
Sweet Spot Percentage
The “sweet spot” is classified as a batted ball hit between an eight and 32-degree launch angle. A hitter’s sweet spot percentage is how often that player produces a batted ball event with a launch angle between that eight and 32-degree threshold. Why does sweet spot percentage matter? Check this out.
Last year, batted balls hit in the “sweet spot” produced a .592 batting average, a 1.101 slugging percentage, and a .699 wOBA. These numbers may not be as strong as barrels, but this blows many other stats out of the window.
Last year, Joey Votto led the league in sweet spot percentage at 44.3 percent. This might speak to why Votto has a career-best season. He coupled this substantial sweet spot percentage with a hard-hit rate north of 50 percent and an average exit velocity that ranked in the 93rd percentile among all hitters.

Fantasy Implication:
Sweet spot percentage is extremely underrated, it appears. The metrics stood up to the test, and sweet spot percentage ranks highly well in batted ball results. This is a stat that is worth diving into a little deeper because the correlation is very good compared to many.
You can use sweet spot percentage to find out how consistent a player’s batted balls are launched at an ideal angle. The more a player finds the sweet spot, the more likely they are to hit for average and power.
Media References: Baseball Savant, MLB.co
m