The majority of fantasy baseball leagues are still what we refer to as standard roto. Even if you play in leagues with more advanced scoring settings, the odds are that one of your categories is ERA. Even if you’re new to fantasy baseball, you probably already know that Earned Run Average (ERA) is simply the result of a pitcher’s performance – it is not predictive. The advantage in fantasy leagues is trying to figure out what a pitcher is going to do, rather than his previous results. Here we are going to look at the process that goes into a pitcher’s performance. This way we can find a pitcher’s more realistic talent level rather than taking his ERA at face value. Here are the sites and metrics I use to evaluate pitching.
What?! Your league is not planning on using Fantrax? Inconceivable! Check out everything Fantrax has to offer and I’m sure you’ll come around to our way of thinking.
How To Evaluate Pitching
The Basics
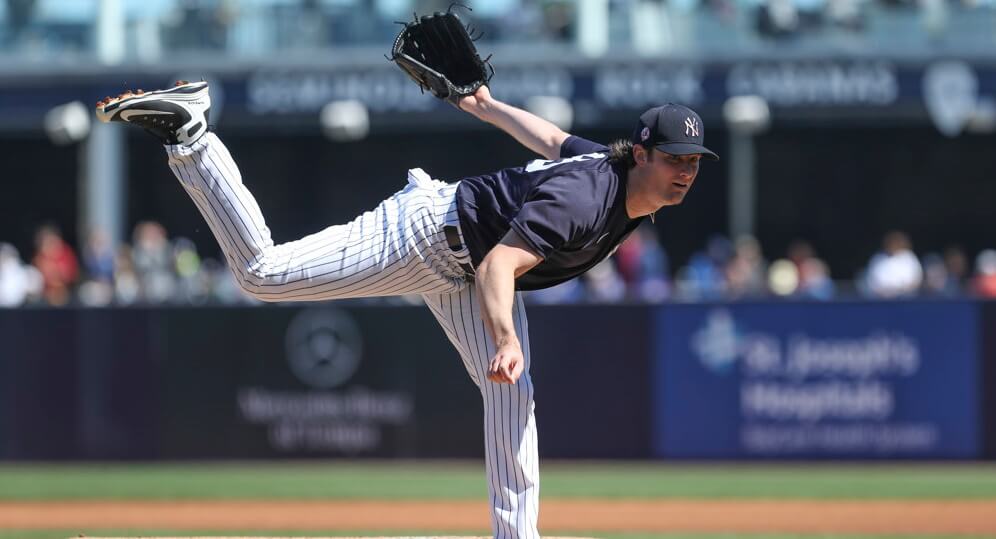
To begin with, we pull up a trusty ol’ Fangraphs page. We’ll take a look at Gerrit Cole’s player page. He’s pretty good at baseball.
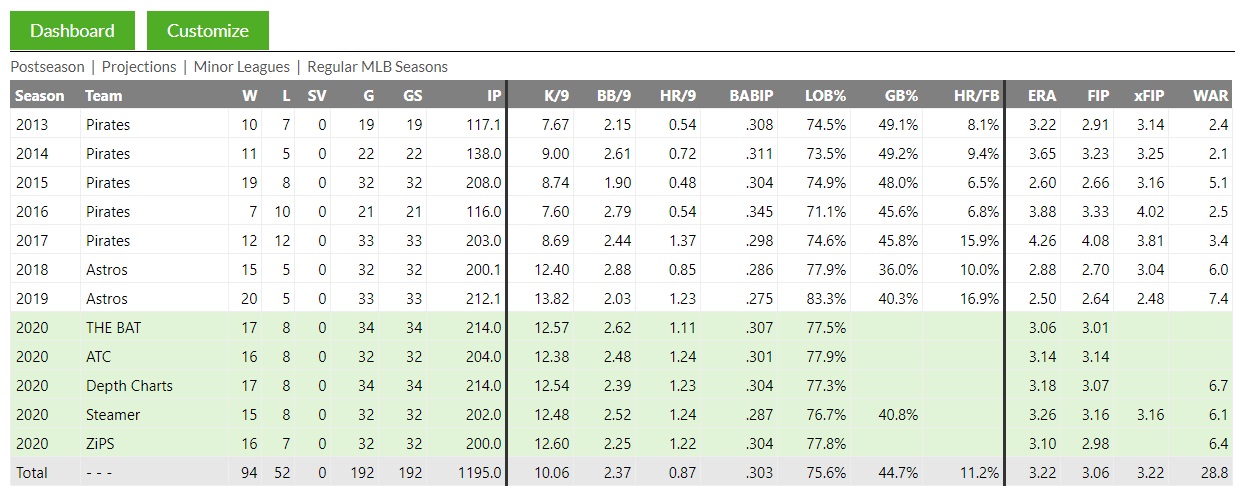
This has all the basics you need. The first thing that pops out is what a difference an organizational change can make! Cole’s strikeouts per nine innings shot up, coinciding with a changing of teams. We’ll dive more into that change in a bit. For now, to give some context, in 2019 the league average K/9 was 8.9, BB/9 was 3.3, and HR/9 was 1.4. The league average ERA was 4.51.
Of course, there is a little more going on here than just strikeout and walk rates. A few of the more advanced stats are so prevalent in today’s game that they blend right into things like a simple win-loss record. BABIP (Batting Average on Balls In Play) is used constantly when evaluating both hitters and pitchers. I wrote about what goes into BABIP and how players batted ball distribution can affect it here. The league average BABIP in 2019 was .296. The farther a player strays from that mark, the less repeatable that performance is generally considered.
Voros McCracken (amazing name) developed the DIPS Theory over 20 years ago. That theory stated that pitchers have little to no control over their BABIP. In the years since that report, we have come to understand that this isn’t entirely true. A huge part of determining a pitcher’s true skill level, though, begins with the basic walk and strikeout rates. A great place to begin with pitchers is to look at their K-BB%. This is the strikeout percentage (rather than K/9) minus their walk percentage. The higher that number, the better. Here is the list of K-BB% leaders from 2019. The league average K-BB% in 2019 was 14.4%.
Plate Discipline
Further on down a player’s Fangraphs page is his Plate Discipline profile.
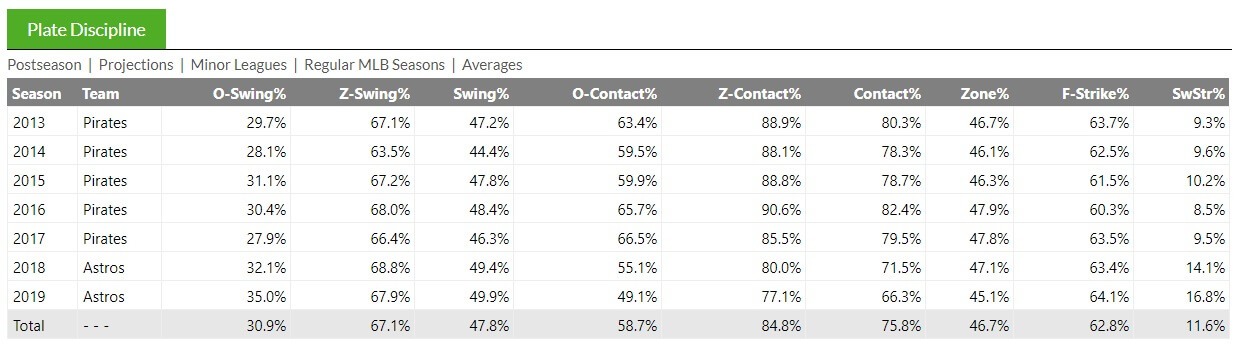
This gives you a more comprehensive understanding of what is fueling a pitcher’s walk and strikeout rate. For example, two of the more important factors behind K% is SwStr% (swinging-strike rate) and O-Swing% (the percentage of swings by opposing batters that reach outside of the strike zone; aka Reach Rate). If a pitcher can consistently get the batter to expand the strike zone and swing at bad pitches that have a low likelihood of getting hit hard, that can lead to a lot of success. A high swinging-strike rate is a good indicator of filthy stuff. Furthermore, a low Z-Contact% (contact rate on pitches within the strike zone) is a good thing. If you are missing bats even on pitches within the strike zone, you’re generally going to have a high K%. For even more on those metrics, click here.
ERA Estimators
One of the other most commonly used advanced statistical categories is the ERA Estimator. There are many different types of ERA Estimators, but most commonly used are FIP, xFIP, and SIERA. If you want more of the nuts and bolts of how these are calculated, check out this piece I wrote on the subject here. The short story is that these estimators are useful because they regress outlier results such as BABIP and LOB% (Left On Base Percentage, aka Strand Rate) to league average. This gives us more of a deserved outcome, helping us identify fluky ERA results.
Splits
Splits are vital when evaluating a pitcher. Lefty/righty splits are a good place to start. If a pitcher is fine against right-handed hitters but gets torched by lefties, he’s going to face lefty-heavy lineups and get exploited. It’s a hole in that pitcher’s game. Home/away splits are important, but oftentimes can be misleading. Only in the more extreme pitcher- or hitter-friendly ballparks should you put much stock into those splits. Rockies pitchers, for example, are going to have much better numbers on the road. Marlins pitchers are generally going to have better numbers at home, pitching in that giant empty cave.
Monthly splits often contain sample sizes too small to take much away from. First and second half splits can help tell the tale of performance improvement or decline. In addition to just looking at first/second-half ERA, you can also see changes in K-BB%, hard contact allowed, or any number of other things. You can also customize your split to fit a timeframe. If a pitcher started throwing a new pitch on July 1st, you can look at the splits before the new pitch and after. That helps quantify the effectiveness of the new pitch.
There are a lot more useful splits as well, such as 1st/2nd/3rd time through the order, results with the bases empty compared to results with runners on base, and much more. Just get in there and play around.
Heat Maps
Heat maps are a useful tool when you want to see just how pitchers attack hitters. It can be helpful to split the maps up against lefties and righties to see the different approaches. When searching for answers behind a change in a player’s performance, it’s often helpful to look at heat maps before and after the change in performance. Whether it’s newfound confidence to throw a slider against lefties, throwing fastballs up in the zone versus low in the zone or any number of other things, heat maps are a quick way to quantify a change in approach.
Utilizing Statcast
One of the best tools to come around in recent years is Baseball Savant and Statcast. Fangraphs and Brooks Baseball have a plethora of amazing tools themselves. With the development of Statcast, however, you can get a lot of the same information in a shinier, more easy-to-consume package.
Pulling up Gerrit Cole’s Statcast page immediately rewards you with an overview of how he ranks in a lot of different categories.
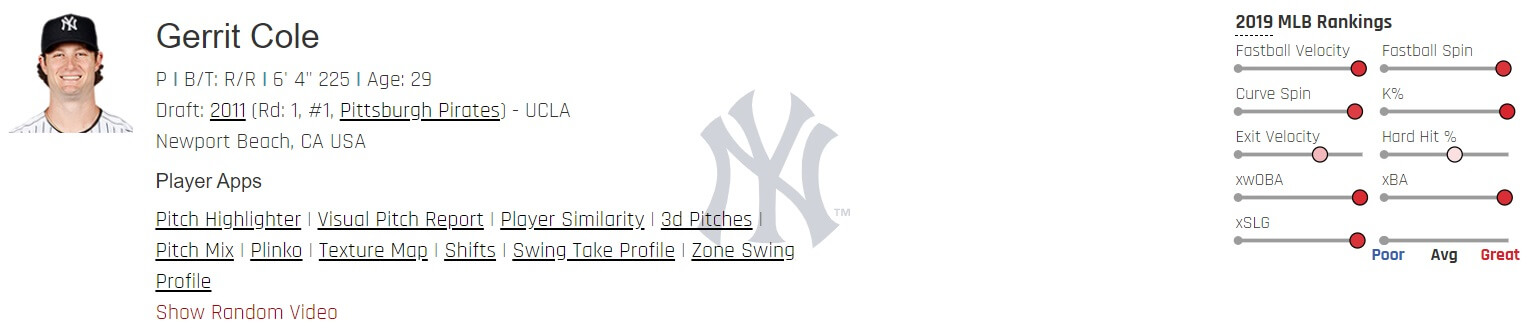
You instantly get a bit of a picture of where a player’s talent level lays. Cole has elite fastball velocity and spin rate (higher spin fastballs tend to rise, low spin fastballs sink). He also has a 94th percentile curveball spin rate. Between that and his fastball, it’s no surprise that his K% was the best in baseball among qualified starters.
Statcast Expected Statistics
Now it’s on to the sweetest stuff: the Statcast expected metrics. Right up there next to Cole’s strikeout rate is his xwOBA (expected weighted on-base average), xBA (expected batting average), and xSLG (expected slugging percentage). In similar fashion to ERA Estimators, these expected metrics iron out anomalous performances and give us deserved results by removing as much luck as possible. Statcast takes every batted ball event and factors in the expected results based on exit velocity (the speed in MPH the ball comes off the bat), launch angle (the trajectory the ball takes off the bat, measured in degrees), and Sprint Speed.
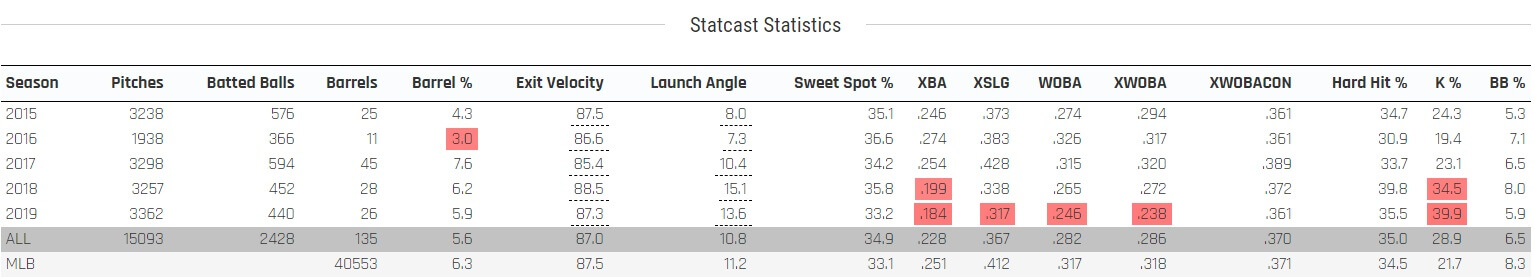
These metrics are all lined up beautifully in this table. In addition to just the numbers, the results are highlighted either red or blue if that number ranked in the top or bottom 10% of players. Some other important stats within this table include the average exit velocity and launch angle allowed by that pitcher. xwOBAcon is a fun stat, and not only because it has “bacon” in it. Ok, so that’s mostly why it’s fun, but it is a good indicator of how hard a pitcher is getting hit when the batter does make contact with the ball.
Barrel rate is also one of the most important stats in today’s game. A “barrel” is the optimal combination of exit velocity and launch angle. Almost all of your home runs are going to be barrels, for example. A barrel has a minimum xBA of .500 and xSLG of 1.500. So yeah, you’ll want to avoid barrels as a pitcher. Here is a link to the 2019 Barrels Per Plate Appearance leaderboard.
Pitch Type And Results
Further down the Statcast player page, you find a breakdown of the pitcher’s arsenal.
![]()
This is a very convenient way to look at the individual pitch performances from a starter’s arsenal. Not only do you get how many of each pitch type was thrown, you get the actual and expected results. You can also see the average exit velocity and launch angle per pitch, giving you the ability to break a pitcher down on a more granular level.

There is also the pitch mix chart. One of the biggest changes a pitcher can make to break out is to alter his pitch usage (or develop a new pitch entirely). As you can see with Gerrit Cole, when he moved to Houston he greatly reduced his sinker usage and threw more sliders. You can also get this information from Fangraphs or Brooks Baseball.
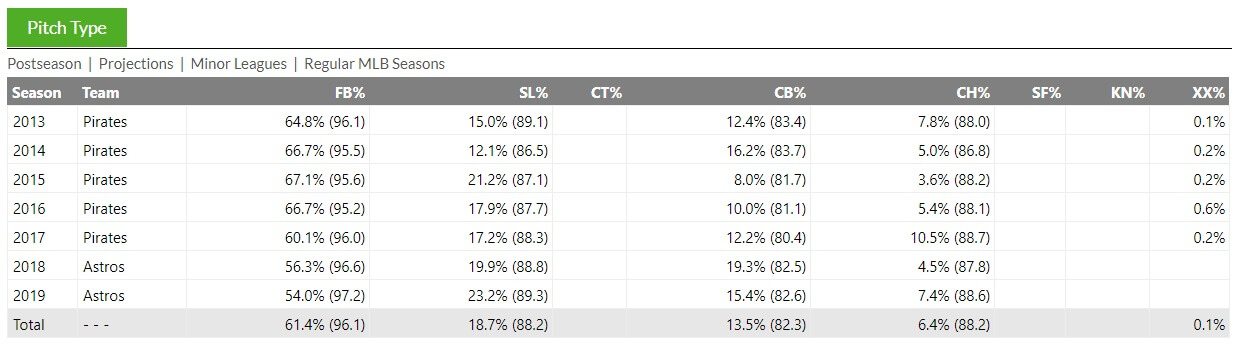
It’s nice to see the actual percentage next to each pitch on the Fangraphs page. However, Fangraphs doesn’t split apart the two- and four-seam fastballs. That isn’t helpful when you have a player altering his fastball mix, or if one of the two fastballs is effective and the other is not. Make sure to consult Savant or Brooks when looking for pitch mix changes. Velocity jumps are another key factor when looking for breakouts, so take a look at pitch velocities when you’re digging into pitch mix changes as well.
Additional Tools to Evaluate Pitching
The mighty Alex Chamberlain has developed a pitch leaderboard which is a lot of fun to play with, and informative. If you want to really get into the nitty-gritty in terms of pitch types, movement, outcomes, expected outcomes, and much more, this is a great tool to use.
So, as you can see, there are a lot of incredible tools at our disposal these days. Personally, I use every one of these sites and tools listed to evaluate pitching. The more you play around with the different sites, the better you’ll be at identifying things like breakouts or buy-low candidates. Have fun!
For more great rankings, strategy, and analysis check out the 2020 FantraxHQ Fantasy Baseball Draft Kit. We’ll be adding more content from now right up until Opening Day!

Fantrax was one of the fastest-growing fantasy sites of 2019 and we’re not letting our foot off the pedal now! With multi-team trades, designated commissioner/league managers, and drag/drop easy click methods, Fantrax is sure to excite the serious fantasy sports fan – sign up now for a free year at Fantrax.com.
The thing I dislike most is when fans make face value comparisons of pitchers from different eras. For example comparing the ERA of a pitcher from the dead ball era with a pitcher from the 20’s 30’s 90’s and 2000’s, or the win total for that matter. This is where sabermetric measures are really important.
I read that some think that SO-BB ratios are good, and they are within time constraints like other pitchers in that league and in that year. But carry that between eras and you might as well be using ERA. In a comparison of the two of the three most dominant Lefties, Lefty Grove and Sandy Koufax (Randy Johnson was not in this particular comparison), Lefty Grove was 128-33, 1408.1 IP (1928-32) and Sandy Koufax was 111-34,1377 IP (1962-66). But Koufax had a 1.95 ERA to Grove’s 2.56. Face value Koufax peak was better. But Grove’s ERA+ was 171 and Koufax’s was 167, a victory for Grove. Koufax averaged 9.44 Ks per game to Grove’s 5.91, but Groves SPG+ was 188 to Koufax’s 164 because strikeouts were only 3.15 league wide in the AL as opposed to 5.76 in the NL league wide. And SO to walk ratio was a reason that Bleacher Report did not put Grove in its all-time top ten pitchers because his strikeout totals were so low and his S0-BB was so low. Actually when controlled by era they are very good, better than most all contemporary pitchers. During Grove peak, the SO-BB ratio was .95; From 2017 2021 the AL SO-BB ratio was2.60. Context matters