Christian Yelich hit 44 home runs over 130 games in 2019. So, there’s no reason he shouldn’t hit another 44 over another full season, right? This fantasy stuff is a piece of cake! Obviously, no one believes it’s that easy. A single season of home runs, RBI, or batting average, is far from predictive. It’s an indication of a possible outcome, to be sure. However, to find the true talent level and accurately evaluate hitters, the wisest route is to take a look at a lot of different (more predictive) metrics. I recently wrote about some great ways to evaluate pitching, which you can find here. This time we’ll take a look at a lot of the tools at our disposal in today’s information age that can aid us in our quest to evaluate hitters as accurately as possible.
What?! Your league is not planning on using Fantrax? Inconceivable! Check out everything Fantrax has to offer and I’m sure you’ll come around to our way of thinking.
How To Evaluate Hitters
The Basics: BABIP
Even the least engaged baseball fans are aware of the basics. Let’s start by heading to Fangraphs and pulling up a player page. We’ll roll with Christian Yelich since I mentioned him in the intro.
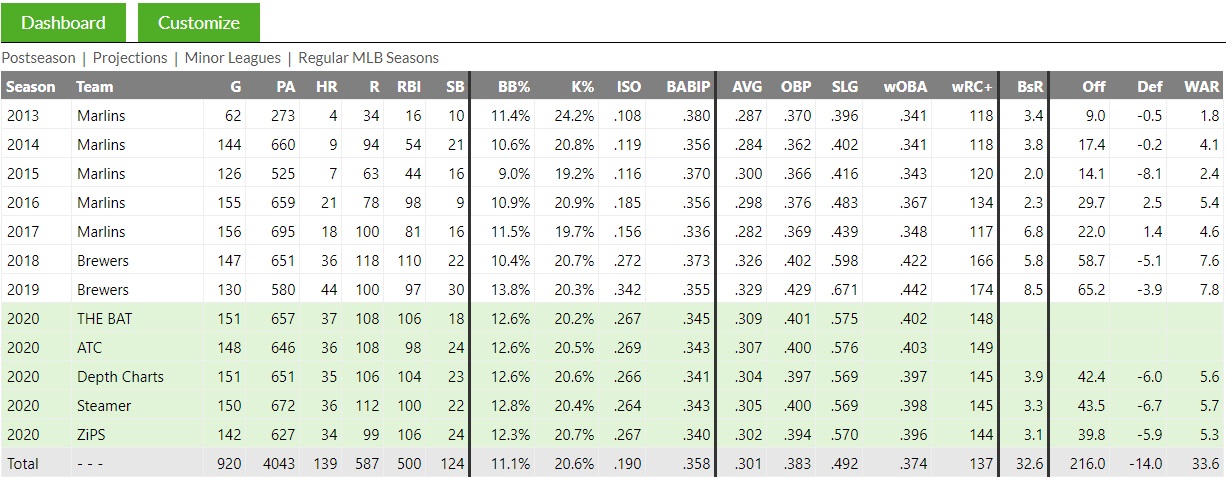
Ahh, all the bare necessities of life. I don’t have to explain to you the basic counting stats, which are all easily found here. When discussing some of the peripheral metrics which are commonly used to evaluate hitters, though, you have to begin with BABIP. As I mentioned in the pitching evaluation piece, the average BABIP in 2019 league-wide was .296. Annual BABIPs are typically somewhere around .300. Generally, any performance far above or below that mark is considered anomalous. There are exceptions, of course.
Contextualizing BABIP
Christian Yelich, for example, has a career .358 BABIP. In fact, he has never had a single season with a BABIP below .336. There are several reasons for this. As I wrote about some time ago here, baseline BABIPs can vary greatly from player to player. A player with a higher sprint speed is usually going to have a higher BABIP than some 40-year-old DH who lumbers down the line to first. If you’re fast, you’re simply going to beat out more throws to first on those balls in play.
Another factor is the quality of contact. The harder you hit the ball, the better the outcome. Launch angle (a Statcast metric measuring the trajectory of the ball off the bat, measured in degrees) is another important aspect. High fly balls turn into easy outs, and soft grounders have the same result. This is why a lot of power hitters have low BABIPs and batting averages. You have to hit a lot of balls in the air to hit all those home runs. Those balls that don’t leave the yard, however, are easily caught fly balls.
It’s not uncommon for fly-ball heavy hitters to have .270-.280 BABIPs consistently. For example, the players with the highest five launch angles in MLB in 2019 (avg. of 22.2 degrees) had an average BABIP of just .261. You can’t hit for power with a low launch angle, but a ton of balls in the air will often lead to a low batting average.
The Basics: ISO, OBP, SLG, OPS, wOBA, & wRC+
ISO, or isolated power, is the difference between a player’s batting average and his slugging percentage. It measures the amount of extra-base hits per player. The league average ISO in 2019 was .183. Typically, if a player has a .200 ISO or better, you can consider him a decent power source. The highest qualified ISO in 2019 came from (shocker) Mike Trout at .353. The lowest was Yolmer Sanchez at .069. He hit two home runs over 555 plate appearances. Woof.
OBP, or on-base percentage, measures how often a player reaches base. This counts hits, walks, and hit-by-pitches. It is quickly replacing batting average across fantasy leagues for several reasons. Namely, the ability to take a walk is a skill. Players with that skill should be rewarded for it. Generally, a player’s walk rate doesn’t fluctuate dramatically year-over-year. Batting average is very fluky. A couple of ground balls that sneak through a hole each week add up over a full season and can artificially inflate BABIP and batting average. OBP is much steadier.
SLG, or slugging percentage, is more of a power metric like ISO. It doesn’t count walks but weights the total amount of bases a player records per at-bat. The league-average SLG in 2019 was .435. OPS (On-Base Plus Slugging) simply adds the player’s OBP and SLG as a comprehensive offensive measurement. The league-average OPS in 2019 was .758.
wOBA (Weighted On-Base Average) is a slightly improved tweak on OPS. Whereas OPS just mashes OBP and SLG together, wOBA weights the way a player reaches base, assigning more value to extra-base hits than walks. The league-average wOBA in 2019 was .320. wRC+ (Weighted Runs Created Plus) normalizes player stats, accounting for things like league and ballpark. The average wRC+ is 100, and the highest wRC+ in 2019 was (you guessed it) Mike Trout at 180.
Batted Ball Data
Continuing down Mr. Yelich’s Fangraphs page, we find his batted ball data.
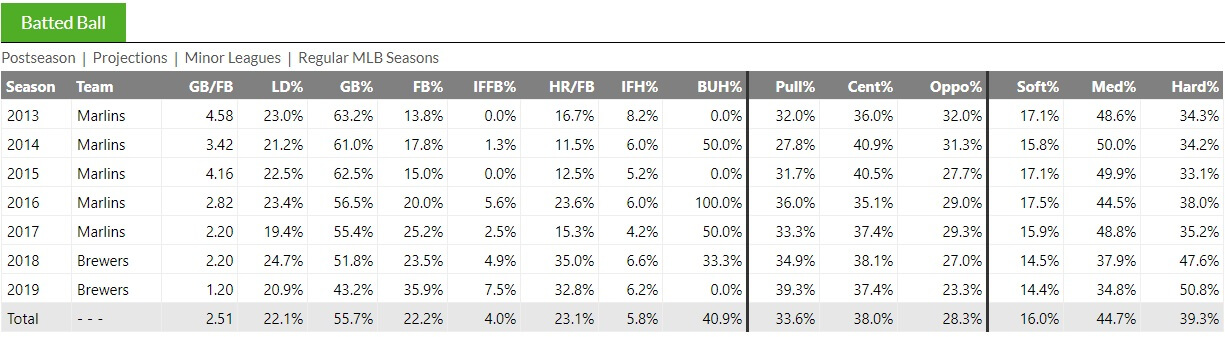
This is a handy breakdown of the number of balls he hits on the ground (GB%), in the air (FB%), and his line-drive rate (LD%). It also lists his pop-up rate (IFFB% – the percentage of fly balls that are pop-ups) and HR/FB (home runs per fly ball). You also see his Pull/Center/Oppo rates, as well as his contact rate breakdowns.
The league-average GB% in 2019 was 42.9%, FB% was 35.7%, and LD% was 21.4%. These breakdowns are different from launch angle, which measures each trajectory rather than objectively dropping batted balls into a certain bucket. Do you see how Yelich’s FB% took a huge leap in 2019? It’s no coincidence that his power spiked as well.
The league-average pop-up rate in 2019 was 9.8%. For hitters, you want this number to be as low as possible because these are automatic outs. The average HR/FB% was 15.3% in 2019, although that number is inflated from prior years by the juiced balls. Only the best power hitters in the league are capable of consistently exceeding 25% HR/FB%.
The higher a player’s pull rate, the more likely it is that he will hit for power. Balls come off the bat harder on a pulled ball. However, for lefties, in particular, pulling the ball too frequently leads to being shifted by the defense. That can have a major negative effect on batting average. Even-spray hitters tend to hit for a better average, but few hitters have the power to hit home runs to all fields consistently.
As I mentioned already, the more hard contact a player makes, the better. Soft contact leads to easy outs. The average Hard% in 2019 was 38%. That brings us to the Statcast version of hard contact rate – Exit Velocity.
Baseball Savant & Statcast
In the past few years, Baseball Savant has come along with a ton of great tools. Their player pages are glorious.

Like I mentioned on the pitching side, these player pages immediately give you a great concept of a player’s strengths and weaknesses. Christian Yelich had 98th percentile exit velocity (measured in MPH). The page also informs you that maybe he isn’t the best defender, but this is fantasy and we don’t care about that.
The Expected Metrics
Along with his sprint speed and the other goodies used to evaluate hitters are Yelich’s expected metrics. We see his xBA, xwOBA, and xSLG are all 98th percentile or better, so yeah, he had a pretty good year. These expected stats are calculated from a combination of the hitter’s exit velocity, launch angle, and sprint speed on every batted ball. Yelich had a .329 average, and his .314 xBA tells us it was well deserved, although perhaps a little lucky.

Further down his Statcast page, we find his batting breakdown. This has all of his expected stats, which are highlighted in either blue or red if they are in the bottom or top 10% in the league. For more breakdowns of things like Barrels and xwOBAcon, again, go check out the Pitching Evaluation piece here. The Exit Velocity & Barrels Statcast Leaderboard is also a thing of glory to behold. Go play with it. You will see quickly that the hitters with the highest Barrels Per Plate Appearance tend to hit for the most power. Stats like Average Home Run Distance and Max Exit Velocity can also validate power.
Pitch Tracking
When you want to get real granular with a hitter, you can dive into his pitch tracking table.
![]()
This breaks down a hitter’s performance and expected performance against specific pitch types. Yelich is a well-rounded hitter, but a lot of players have weaknesses against a certain pitch type. Some breakouts can be backed up by improved performance against a pitch they previously struggled against.
Plate Discipline
Finally, we arrive at Yelich’s plate discipline table.
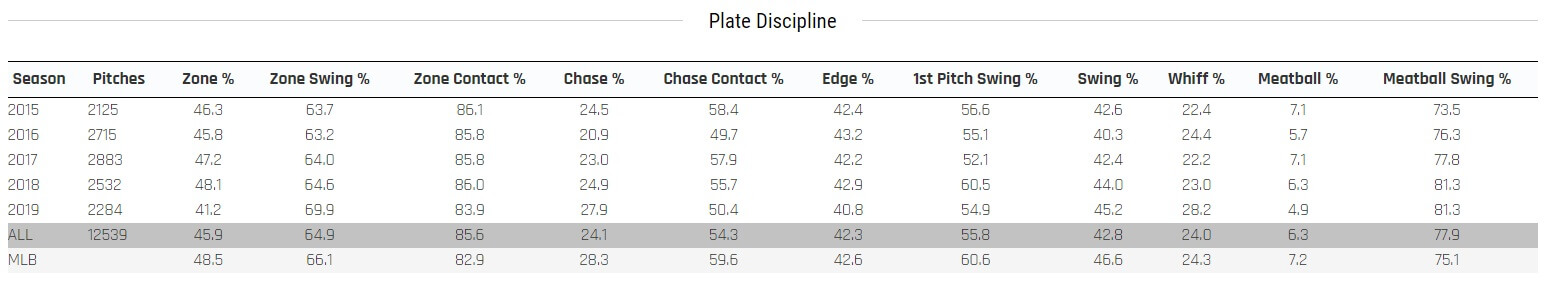
This can tell us a lot about a player’s strengths and weaknesses at the dish. If a player’s Chase% (or O-Swing% on Fangraphs) is very high – say, 40% or more – that player will generally strike out a lot and walk very little. The inverse is also true most of the time. Patient hitters with a low Swing% and Chase% will walk a lot year-over-year.
Strikeout rate can also be estimated by how often a batter swings and misses. Statcast has Whiff% for this while Fangraphs has swinging-strike rate (SwStr%). The lower the swing-and-miss rate and the higher the contact rate, the better a hitter’s average tends to be. You can’t put the ball in play when you’re striking out! For more on plate discipline, check out this Sabermetric Series entry.
Splits, Spray Charts, & More
There is already a ton of information to digest here, but analyzing a batter’s splits are a must. This gives you a comprehensive idea of how well that player performs against left- or right-handed pitching, just to begin with. There are also spray charts, which show you the batted ball distribution for a player instead of just numbers on a page. Heat maps are also another great tool to help analyze the weak and strong points a hitter has on pitches in and out of the strike zone. There are a ton of great resources to evaluate hitters out there, and this is just a start. Have fun, and make yourself a better fantasy player at the same time.
What tools do you use to evaluate hitters? Share your ideas in the comments below.
For more great rankings, strategy, and analysis check out the 2020 FantraxHQ Fantasy Baseball Draft Kit. We’ll be adding more content and updating everything the minute we know when the season will start!

Fantrax was one of the fastest-growing fantasy sites of 2019 and we’re not letting our foot off the pedal now! With multi-team trades, designated commissioner/league managers, and drag/drop easy click methods, Fantrax is sure to excite the serious fantasy sports fan – sign up now for a free year at Fantrax.com.