We have officially passed the halfway point of the season. Hopefully, your fantasy baseball teams are booming and toward the top of the standings. For others, the season has not been very kind, thanks to injuries and poor performances from high-end players. Today, I want to dive in on several of those struggling players you likely drafted toward the top of your drafts. When I think of those struggling players, Cody Bellinger, Christian Yelich, and Anthony Rendon all come to mind. Why are they performing poorly, and does statcast data indicate a better second half is on the way?
What?! Your league is not using Fantrax? Inconceivable! Check out everything Fantrax has to offer and I’m sure you’ll come around to our way of thinking.
Statcast Analysis on Struggling Stars
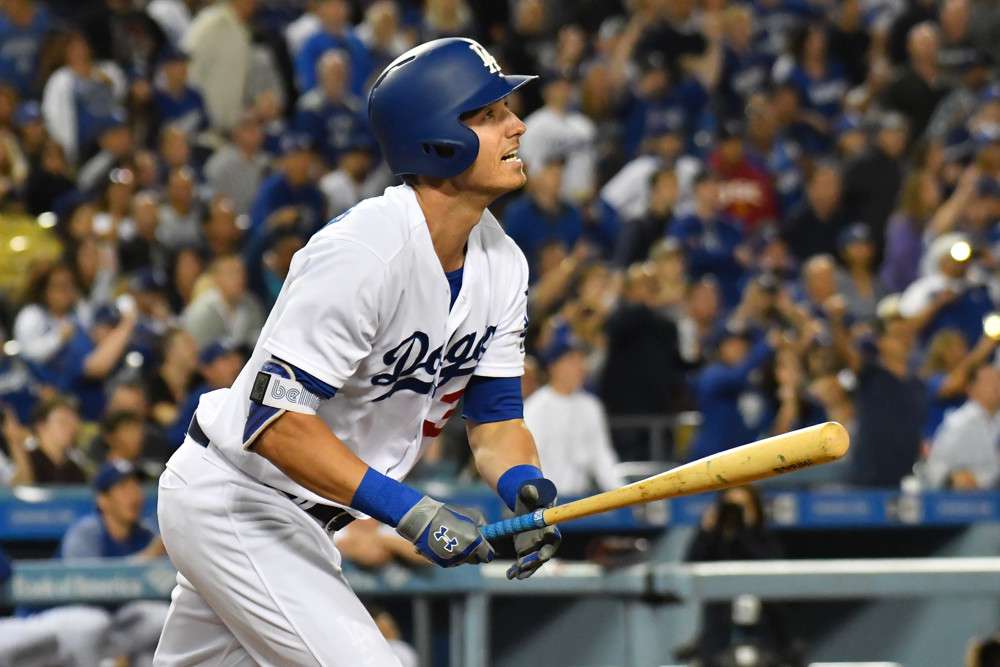
Cody Bellinger, OF/1B, Los Angeles Dodgers
To say it has been a disappointing season for Cody Bellinger is an understatement. This spring, Bellinger was selected at an average draft pick of 16.54, according to NFBC. Injuries have limited Bellinger to just 159 plate appearances, and those have not been great. Bellinger currently has a .164/.283/.276 slash line with just four home runs and two stolen bases. Bellinger’s 2019 MVP season seems like a distant memory at this point. That season he hit 47 home runs, stole 15 bases, and slashed .305/.406/.629.
Is there hope for Bellinger to improve in the second half? I certainly hope so. I roster Bellinger in several leagues, so I would love for him to turn it around!
Right off the bat, a couple of numbers jump out to me. First, Bellinger’s strikeout rate has ballooned. He is striking out at a 27 percent rate instead of just 16.6 percent between 2019 and 2020. Bellinger is also supporting a .202 BABIP, much lower than his .286 BABIP between 2019 and 2020.
When diving in on Bellinger’s statcast data, it is not pretty. According to Baseball Savant, Bellinger has produced a 7.5 percent barrel rate and an 89 mph average exit velocity. Both are career lows. Surprisingly, Bellinger has never produced elite average exit velocities considering his power output. But this year, his max exit velocity is just 106.7 mph. Every season of his career, he has produced a max exit velocity of at least 110.6 mph.
One of the most notable differences in his profile is Bellinger’s average launch angle of 23 degrees. When you aren’t hitting the ball with power like Joey Gallo, it is hard to be productive with a 23-degree launch angle. Notably, Bellinger is hitting more fly balls but also more pop-ups. His home run per fly ball rate is down to just 9.3 percent.
Bellinger is also with pitches inside, especially those at the top and bottom of the zone. Check out the zone map below. Between 2019 and 2020, Bellinger handled pitches low in the zone extremely well. This season, however, Bellinger is clearly struggling. His contact rate is down largely thanks to being exploited with more pitches in those zones.

It is important to remember Bellinger has played just 38 games thanks to injuries. That is the equivalent of an early-season struggle through parts of May. There is still plenty of time for Bellinger to get going, and he is working extremely hard to fix the holes in his swing. I would expect a better second half, but I would not expect Bellinger to return to his MVP caliber 2019 form.
Christian Yelich, OF, Milwaukee Brewers
Christian Yelich has not been quite the disappointment that Bellinger has, but he still has struggled and failed to return value to those who drafted him at an average pick of 10.92 this spring. Yelich currently owns a higher on-base percentage than slugging percentage, which is never good. He has a .244/.398/.383 slash with six home runs and seven stolen bases.
Yelich looks like a shade of his Marlins self and not the breakout player we saw breakout in Milwaukee. A large part of his problem is his patience at the plate and his ground ball rate. Yelich’s walk rate of 19.3 percent is one of the highest in baseball but, his strikeout rate of 27.2 percent also is a factor of him working deeper into counts. From 2015-2019, Yelich produced an 11.2 percent walk rate and a 20.2 percent strikeout rate. Between 2020 and 2021, Yelich has a 19 percent walk rate and a 28.9 percent strikeout rate.
On the statcast side, Yelich is hitting the ball extremely hard. His max exit velocity ranks 94th percentile and is higher than his max from any season except 2019. Yelich’s average exit velocity is notably down. Between 2018 and 2020, Yelich produced 92.6, 93.3, and 94 mph average exit velocities, respectively. This season that number is down to 90.2 mph. It is worth noting, however that Yelich owns a 49.6 percent hard-hit rate. Yelich also owns a 96.1 mph average exit velocity on line drives and fly balls, according to statcast data. That just goes to show how often Yelich is hitting the ball on the ground.
Yelich is also struggling on pitches in the heart of the zone. His swing percentage has consistently dropped over the last two seasons, despite seeing more pitches in the zone. Yelich should be attacking these pitches over the heart of the plate, but he is not.

Yelich has been good but not great. As long as Yelich continues to put the ball on the ground over 50 percent of the time with a launch angle of 2.1 degrees, he will not get to his home run power. Maybe Yelich should have participated in the home run derby like Juan Soto to work on his launch angle.
Anthony Rendon, 3B, Los Angeles Angels
Anthony Rendon was not drafted as high as Bellinger or Yelich, but he was still a third-round pick, according to NFBC. He has not returned value anywhere near his 39.8 ADP. Rendon has spent much of the year injured, but during his 58 games played, he has hit just 6 home runs and a .240/.329/.382 slash.
While Rendon has seen a dip in his performance since joining the Angels, his contact remains elite. It is down a touch this season, but still very good. Rendon has also never been a statcast darling but has seen those numbers drop even more this season. I wonder if lingering injuries have affected his performance.
From a statcast standpoint, Rendon has a below-average exit velocity, according to Baseball Savant. His max exit velocity is also down to 106 mph from 109.1 last season. Like Bellinger, Rendon has an inflated launch angle and has not hit the ball hard enough to leave the yard. While batting average is usually Rendon’s cup of tea, it has not been this season. His .233 expected batting average does not give much hope moving forward.
Rendon’s lingering injuries may have affected his performance this season. Four trips to the injured list have been frustrating for Rendon. Hopefully, he can get healthy and back on track as far as performance.
Media References: Baseball Savant
Thanks for checking out this week’s statcast article. Be sure to check out Eric Cross’s updated Top Fantasy Baseball Prospects.

Fantrax was one of the fastest-growing fantasy sites of 2020, and we’re not stopping now. With multi-team trades, designated commissioner/league managers, and drag/drop easy click methods, Fantrax is sure to excite the serious fantasy sports fan – sign up now for a free year at Fantrax.com.