As Statcast data becomes more commonplace in fantasy baseball analysis, we decided to roll out a new weekly series to dig specifically into these metrics and try to uncover helpful trends for fantasy owners. With the season starting this Thursday, March 29, this introductory article will highlight the key themes you will see each week and offer a few nuggets for players I am keeping a close eye on heading into the 2018 season.
The headers below will be the repeating sections we explore each week. I anticipate the scope and definition of each to vary as the season progresses and I receive feedback from you (contact info at the bottom of this post), but the initial concepts are defined in this week’s article. My goal with each section is to focus on predictive metrics that are trending in a positive direction for a subset of players and should give cause for acquiring these players in your fantasy leagues to reap the rewards of their future success. We’ll also look at players with negative trends in these areas, which might be indicative of injury or future struggles. Again, this might change as we gain traction in certain areas but I’ve decided to cast a wide net at the start and narrow the focus as we see what works. Here are the sections we will dive into every week:
Velocity Movers
This is all about fastball velocity. Who is trending up and who is trending down? We’ll look at both starters and relievers and compare their recent appearances to their current and prior season averages. For starters, I’m more concerned about declining fastball velocity because any noticeable dips could be indicative of injury or when injury isn’t the case it will almost assuredly lead to ineffectiveness. We’ll take a look at any starters who are struggling, and if their production coincides with a decline in velocity, we’ll pin those pitchers and check-in weekly to see if the trend begins to change.
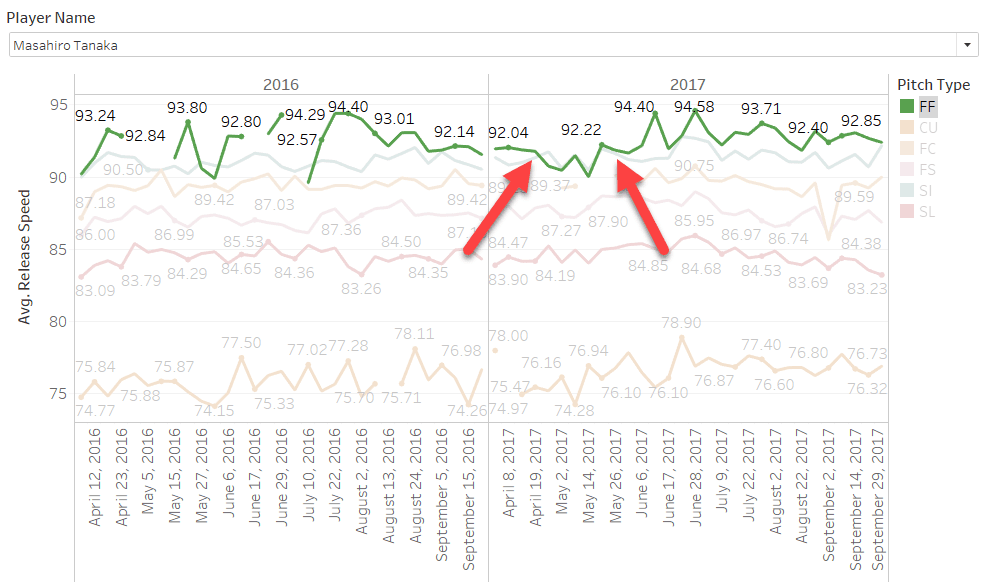
Masahiro Tanaka is an excellent example from last year. He started to really struggle early in May 2017 with an 8.42 ERA for the month, and we can point to the first arrow in the chart below to show it was tied to a decline in fastball velocity, down to 90 mph compared to his 92.7 mph career average. At the end of May, we would’ve seen his fastball velocity return to the 92-93 range and would have felt comfortable that a return to normal production was in the future. Sure enough, Tanaka rattled off month’s of 3.94, 3.82, and 2.63 ERA in the summer.
This is a cherry-picked example, but a realistic scenario we would have come across in this series last year. I hope to gather input from the readers for players to dig into and include in this section. Another area of focus here will be recently promoted relievers. Many bullpen arms pop up each season and provide both valuable strikeout and ratio numbers as well as an outside opportunity to make it into the closer role. My goal is to highlight the unheralded arms that find early success and might be worth a flier in your fantasy leagues. The list below is a preview of the names that surfaced when applying a few filters:
- FB velocity > 94 mph
- SwStrk% > 10%
- At least 50 fastballs thrown in 2017
- Did not meet all three of the above parameters in 2016
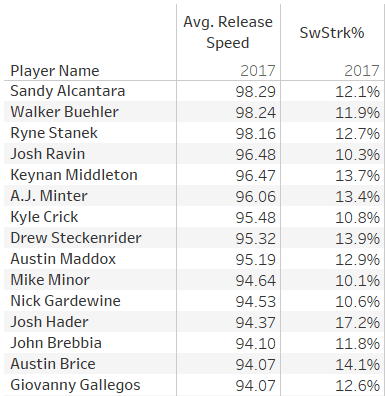
This list is full of my favorite sleeper arms heading into 2018, including Keynan Middleton, A.J. Minter, Drew Steckenrider, and a rebound from Mike Minor in Texas.
Launch Angle Shifts
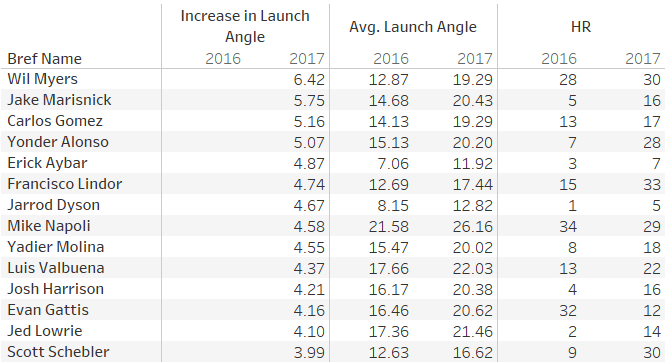
Here we’ll take a look at players who have made significant changes to their launch angle. This is a trickier one to look at because it fluctuates quite a bit in small sample sizes, but noticeable trends do still emerge. The leaderboard below is what we will repeat each week to highlight players with big jumps in their average launch angle. If we look at the comparison of 2016 vs. 2017 data, we see a lot of names who provided unexpected power in 2017 – Jake Marisnick, Yonder Alonso, Francisco Lindor, Josh Harrison, and Jed Lowrie. Our goal will be to identify these players early in the season and reap the rewards.
Sequencing Changes
We’re also going to look at changes in pitch sequencing. This one will be a little harder to mine for, but as anecdotes leak out from beat reporters about a player’s change in sequencing or addition of a new pitch, we can back up those claims here. Charlie Morton was a prime example last year when moving to Houston and increasing the reliance on his curveball. The graphic below highlights his difference in pitch usage from 2017 to 2015 (his last full season) — blue means the pitch is being used more in that count; orange means it is being used less compared to 2015.
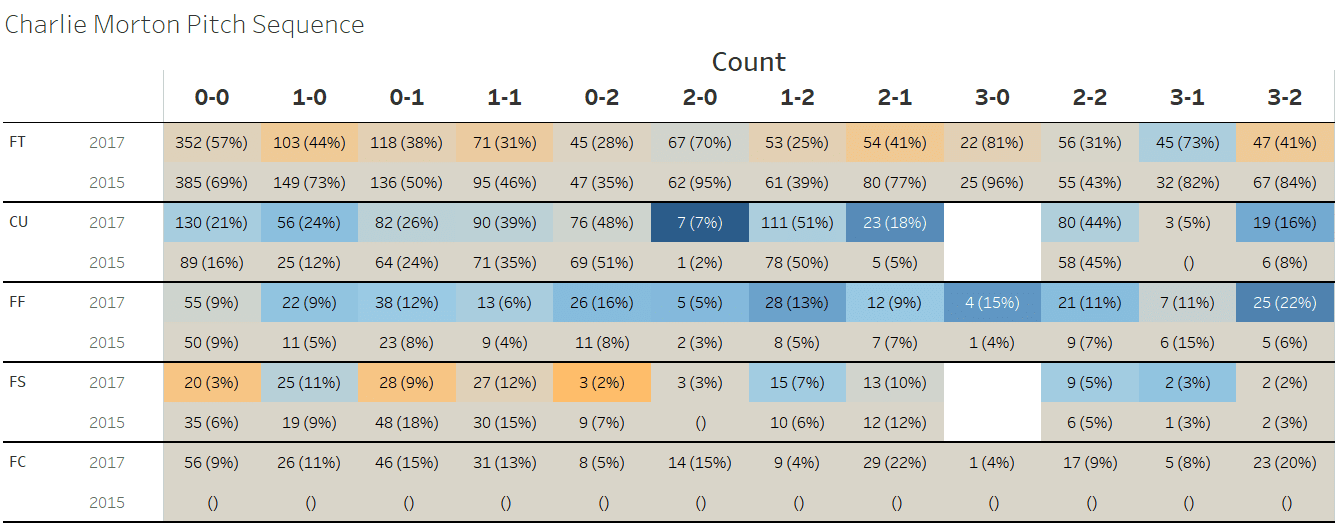
It is incredible to look at his increased reliance on the curveball in every count except for zero balls and two strikes, when you would expect the curveball to be the most likely. Morton’s pitch mix became more unpredictable and he found a ton of success as a result.
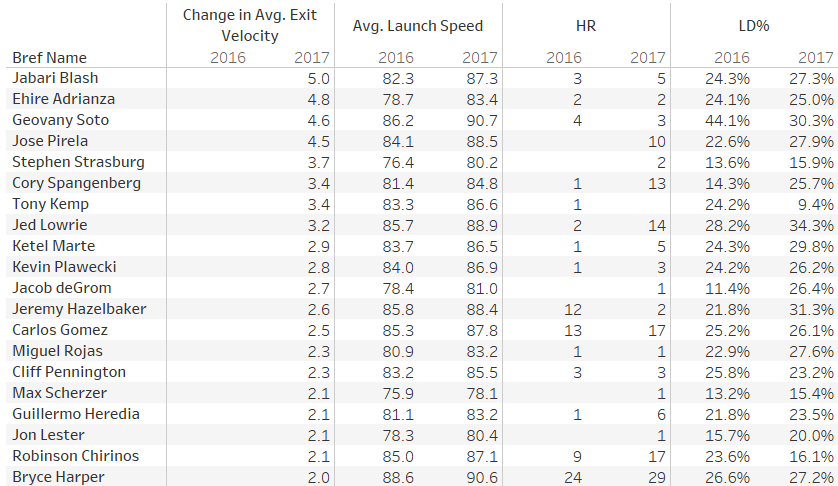
Exit Velocity Improvements
Scanning for improvements in exit velocity is another way to filter to a list of breakout players. If we sort players by improvement in exit velocity, we get a list of players who provided sneaky value in 2017 — Jose Pirela, Ketel Marte, Cory Spangenberg, and Robinson Chirinos are all players that went undrafted.
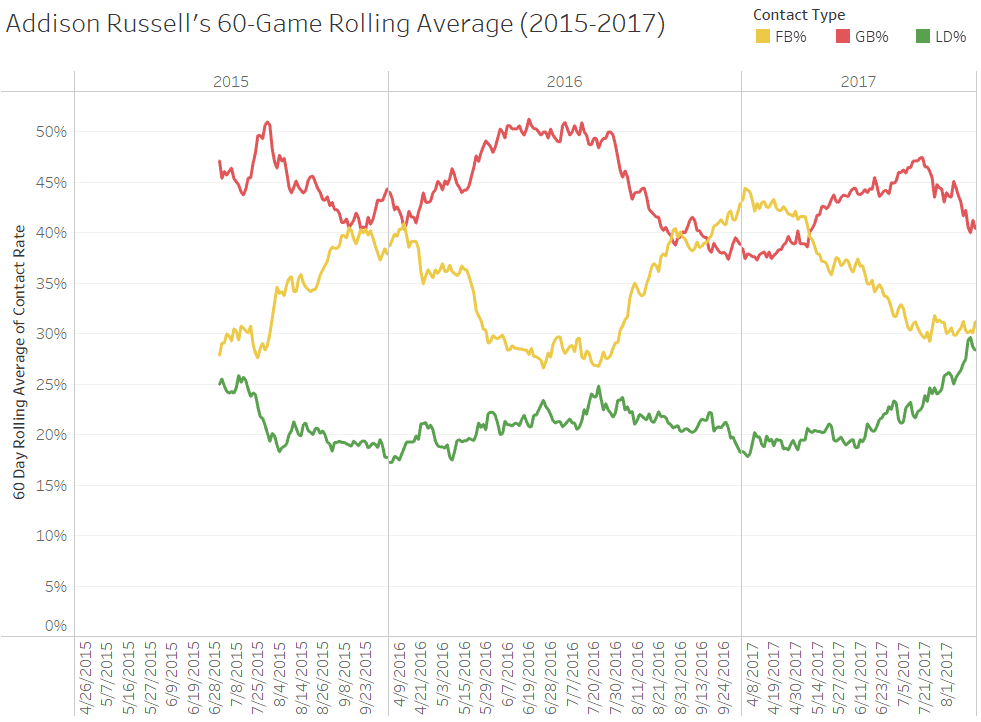
Batted Ball Profile
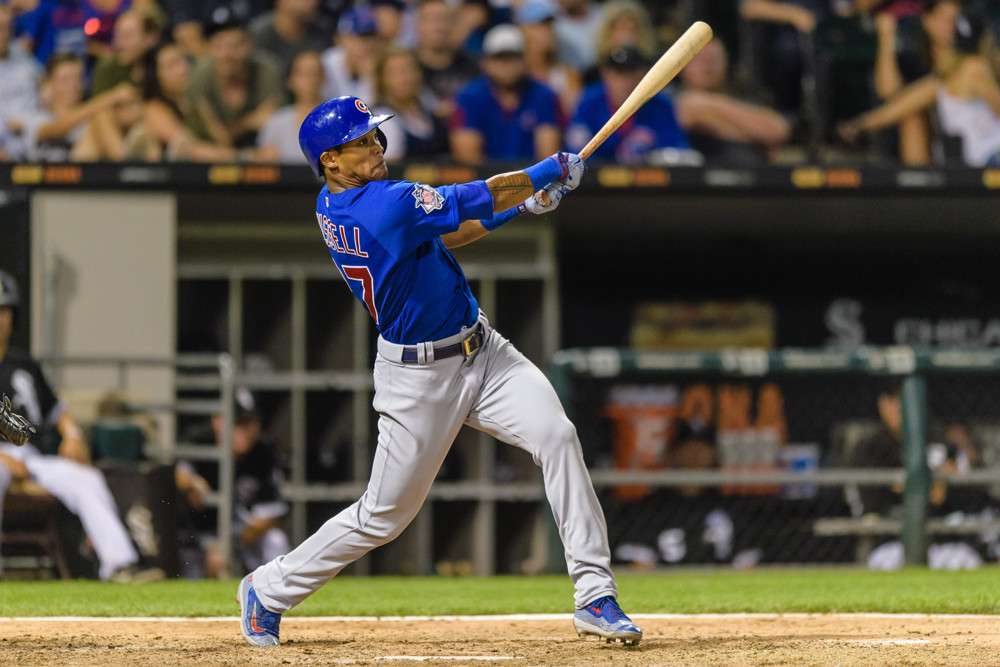
We’ll also set up a leaderboard that looks at shifts in batted ball profiles. This will take a few weeks to mature, but a sample is below looking at Addison Russell’s 60-game rolling average of batted ball type. I love what we saw in the last two months from Russell’s line drive rate, and I am optimistic that this continues into 2018 and we see a bounce-back year from Addison Russell.
That’s all for now. Be sure to read next week when we get our first bit of regular season data rolling through! In the meantime, please be sure to reach out via email ([email protected]) or Twitter (@BrianCreagh) if you have any questions, comments, or suggestions.