Chris Allen looks at roster construction for best-ball leagues and how you should approach the tight end position.
“Dumpster fire.”
“Wasteland.”
“Just stream them.”
The above are common descriptors or phrases used when dealing with both tight ends and team defenses in best-ball. Still a part of the ‘onesie’ position category, but the supply of replaceable talent is remarkably small. It forces drafters to consider two paths to building a roster:
1 – Spend significant draft capital to acquire the elite talent while foregoing opportunity cost.
2 – Use additional draft picks to acquire talent at or below replacement level.
Like the process for drafting quarterbacks in best-ball, both approaches are viable depending on an understanding of roster construction and player projections. Here we’ll take an analytical approach to better understanding the optimal draft capital to spend on the last of the onesie positions.
Can’t wait for next fantasy football season? Who are we kidding? It’s always Best Ball time! leagues are now forming at Fantrax.com!
Tight End
| Number of TEs | Count | Total | Win Rate |
| 1 | 2 | 23 | 8.7% |
| 2 | 51 | 616 | 8.3% |
| 3 | 66 | 766 | 8.6% |
| 4 | 1 | 31 | 3.2% |
The first row is another lesson in sample size errors. At first glance, the 8.7 percent win rate for best-ball builds with a single tight end would be…misleading. Surprising it worked, but a suboptimal play when considering at least one bye week, weekly production, and injury risk. However, the key takeaway is that 2 and 3 TE builds were the optimal strategies.
The strategies surrounding TE drafting in best-ball are simplistic but tough to implement. ADP doesn’t always correlate with how we value a player. So, either strategy can quickly implode if the right players are taken off the board. Tiered ranking becomes invaluable at these times as drafters can essentially bin multiple players into a production range. While a specific player might have been drafted, another at their replacement level might be available. The other question posed is ‘When?’. How soon to draft a tight end primarily depends on the approach. Let’s start with a 2 tight end build.
Two Tight End Build
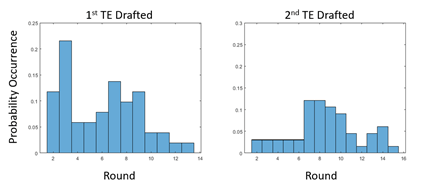
Peak occurrences amongst winning best-ball teams support the first draft strategy. An early round tight end selection typically led to a second acquisition in the mid to late rounds. Putting theory to practice would yield a tight end duo of Zach Ertz and Jack Doyle. Or Rob Gronkowski and George Kittle. The combinations are endless, but the upside to the strategy is clear. There are clear paths to weekly targets for both tight ends at the start of the season. This should result in a guaranteed floor of weekly points.
The fragility of the strategy is also evident. Tight end injury rates are on par with wide receivers given their usage as both a receiver and blocker. But with less replaceable talent, the drop off in production is severe. Opportunity cost is another risk factor. The slew of running backs and wide receivers selected alongside the elite tight ends are hard to pass up given the need to start 2 or 3 each week. The high-risk nature forces some drafters to turn to a 3 tight end build. A safer approach that looks to optimize draft capital at the positions of need. But, of course, the path looks slightly different.
Three Tight End Build
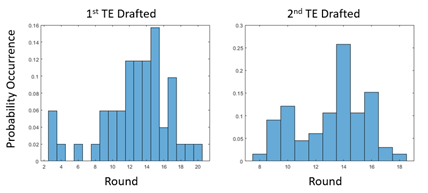
Again, the winning teams in best-ball personify the strategy. The first tight end in the build isn’t drafted until the double-digit rounds with the second tight end coming soon after. David Njoku and Jared Cook as the primary duo with Jonnu Smith to round out the trio. The trade-off from the first strategy becomes obvious. Drafters have 10 rounds to develop their core. Whether it be 4 running backs and 6 wide receivers, or take away a receiver and draft a quarterback, most of a weekly starting roster is set. The tight ends just drop into place as needed. This goes with the optimal strategy surrounding the position. Our draft capital shouldn’t hinge on a position where only one player is required. The elites break the rule, but the dearth of talent at the position points to the long-term viability of drafting 3 tight ends in best-ball.
Team Defenses
The 2016 Chiefs.
The 2017 Jaguars.
The 2018 Bears.
Every year produces a different top fantasy defense. The discussion during the following offseason is if that same defense is worth an earlier pick. The Jaguars spawned such a discussion after their 2017 performance. Their 55 sacks were the most since the 2013 Panthers. The 2014 Eagles defense was the last to have 7 touchdowns. But that did not mean their ADP should ascend with their popularity.
There are two main ideas for evaluating team defenses. First, year to year finishes are volatile with few returning to their previous mark. The 2018 Jaguars are a primary example. Second, the number of impact weeks are surprisingly few. Let’s set the bar at 15 PPR points. Those are low-RB1 and low-WR2 numbers based on 2018 results. Just looking at the Top-5 defenses from 2018, here’s how many times they hit that mark all season:
| Rams | 4 |
| Ravens | 4 |
| Bears | 3 |
| Patriots | 3 |
| Texans | 2 |
At best, defenses impacted weekly scoring 25 percent of the time in 2018. And yet, the Jaguars’ had an August ADP of 98.8. That’s just after Drew Brees and before every mid to late-round quarterback taken in 2018. But the approach to this final onsie position is similar in nature. We can start with the same questions: How many? How soon? The answers to these will give a sense of how to apply the most optimal strategy.
| TmD | Count | Total | Win Rate |
| 1 | 1 | 91 | 1.1% |
| 2 | 104 | 1123 | 9.3% |
| 3 | 16 | 236 | 6.8% |
Again, somehow, somebody drafted a single defense and won their best-ball league. The draft room can be a wild place. However, two defense builds held a significant edge over the field in 2018. Supply and demand likely dictated this result.
Takeaways
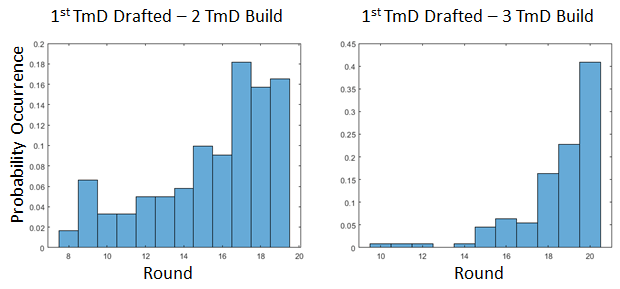
The optimal best-ball strategy for defenses looks at two aspects: cost and team offense. The cost, as indicated by the data, shows the greatest value at the backend of drafts relative to win rate (16th round or later). A quick regression analysis looked at comparing various offensive metrics to defensive win rate.
| r-squared | |
| PPG | 0.1096 |
| Yards Per Game | 0.0265 |
| Plays Per Game | 0.0069 |
| Yards Per Play | 0.0232 |
| First Downs Per Game | 0.0377 |
| Time of Pos % Per Game | 0.0089 |
| 3rd Down Conv % | 0.0392 |
| 4th Down Conv % | 0.0566 |
This is nothing definitive, but it is suggestive of a larger narrative. Teams with even an average offense can lift up a talented defensive unit. The same goes for an elite offense with an average defense. Kansas City was clearly in need of both corner and safety help, but teams were forced to throw in order to keep up with Patrick Mahomes. Throws lead to sacks, turnovers, and touchdowns. It’s these key components that can guide any drafter to a winning roster in best-ball.
Chris Allen comes from an analytical background, leveraging his data skills with his multiple years of experience across different formats (e.g. seasonal redraft, DFS, MFL10). His primary focus has been the analysis of weather effects and its impact on games, player output variance, and the validity of the associated narratives. Chris’ writings have been featured on multiple websites including Fantrax, 4for4, and, most recently, Sports Illustrated. Chris can also be heard as co-host on the Dynasty Owners Manual podcast and is a member of the FSWA.

Fantrax was one of the fastest growing fantasy sites of 2018. With multi-team trades, designated commissioner/league managers, and drag/drop easy click methods, Fantrax is sure to excite the serious fantasy sports fan – sign up now for a free year at Fantrax.com.