Best-ball is more than just filling 20 draft slots. How many players at each position and how soon they’re drafted changes the complexion of your final roster. It can also affect your chances of winning. Part I in the series highlighted roster construction. Specific builds were shown to have an edge on the field by their greater win rates. The most interesting aspect of the builds was the investment in the running back position.
| RB | Obs | Wins | Win Rate |
| 5 | 532 | 43 | 8.08% |
| 6 | 660 | 59 | 8.94% |
| 7 | 170 | 15 | 8.82% |
Best-ball’s PPR scoring has generally boosted wide receivers and elevated change-of-pace running backs. However, 2018 was all about the ‘value’ running back. While running backs were drafted in nine of the 12 first round slots, the later rounds provided the most value with respect to win rate. This second installment digs a bit deeper into the running backs, which players helped drafters cash the most often, and storylines/strategy we can take into 2019.
Can’t wait for next fantasy football season? Who are we kidding? It’s always Best Ball time! leagues are now forming at Fantrax.com!
NFL Best-Ball: Running Back Value
Top 12 Running Backs
Hindsight is always 20/20. This makes the names on the list of Top 12 running backs by win rate easily recognizable.
|
RB
|
Win Rate
|
| Christian McCaffrey |
25.62%
|
| James White |
21.49%
|
| Tarik Cohen |
19.83%
|
| Austin Ekeler |
16.53%
|
| Alvin Kamara |
15.70%
|
| Saquon Barkley |
15.70%
|
| Chris Carson |
14.88%
|
| Derrick Henry |
14.88%
|
| Matt Breida |
14.88%
|
| Marlon Mack |
14.05%
|
| Todd Gurley II |
14.05%
|
| Nick Chubb |
12.40%
|
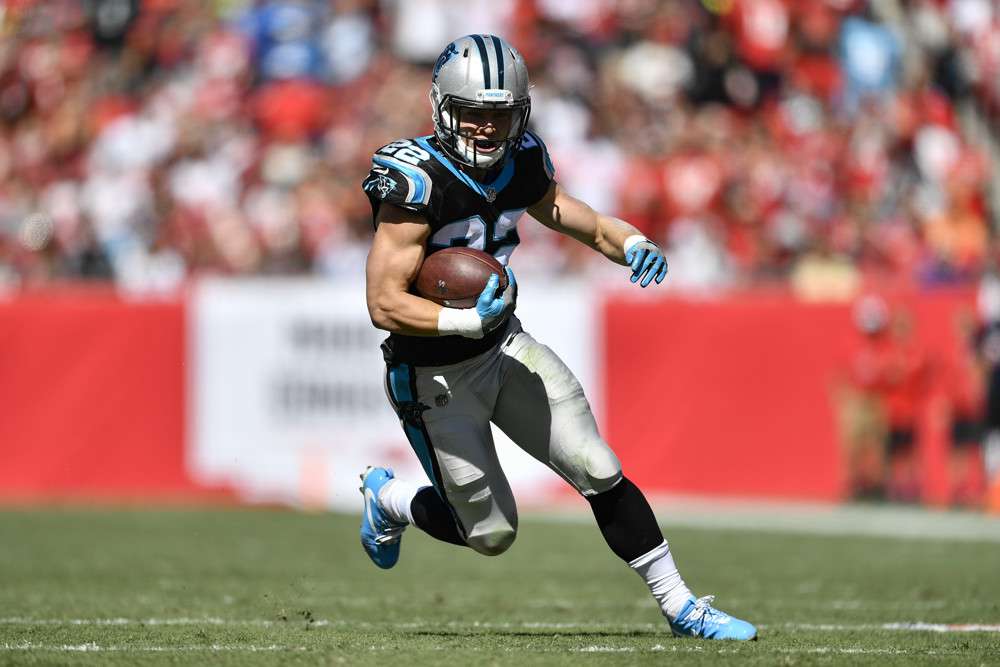
If you drafted Christian McCaffrey in best-ball, you likely cashed. His 25.6 percent win rate was top amongst RBs and emphasizes the traits we look for at the position in best-ball. He received the majority share of touches on the ground for his team while receiving the most targets in the league for running backs (T-17th overall). While the production was well received, his cost was more appealing. McCaffrey’s ADP rose from 21.9 to 16.3 over the course of the 2018 offseason. He outproduced every running back with a first-round ADP. Surprisingly, that happened quite frequently to the first-round running backs all drafters clamored to have on their rosters.
The Cost
First-round running backs only accounted for 25 percent of the Top 12 with respect to win rate. Projections were based on their teams in their optimum format. All supporting personnel healthy. Positive game scripts. Majority of the touches. But every season is filled with its own plot twists. Injuries, coaching changes, and trades happen every season affecting player value. These scenarios must be considered and add to the criteria of players to draft as there is no waiver wire to react to these situations in best-ball leagues. However, the solution isn’t to overreact.
Recent bias has taken over the best-ball lobbies. Running backs have continued to dominate the first round to recapture the 2018 magic. But, seeing the increased win rates for drafting 6 or 7 running should not lead to drafting more in the early rounds. Look at the season-long shifts in situations that lead to those high win rates. We must also consider the opportunity cost required to draft so many at a single position. To analyze this further, let’s dive a little deeper.
Roster Construction
Histograms can be used to visualize the likelihood of a value occurring within a dataset. In this, the question being asked is simple:
‘If 6 or 7 running backs are drafted, by what round were at least 3 drafted?’
This is to get a sense of early to mid-round roster construction for winning teams. If running backs were the priority, it’d be reflected in draft equity spent.
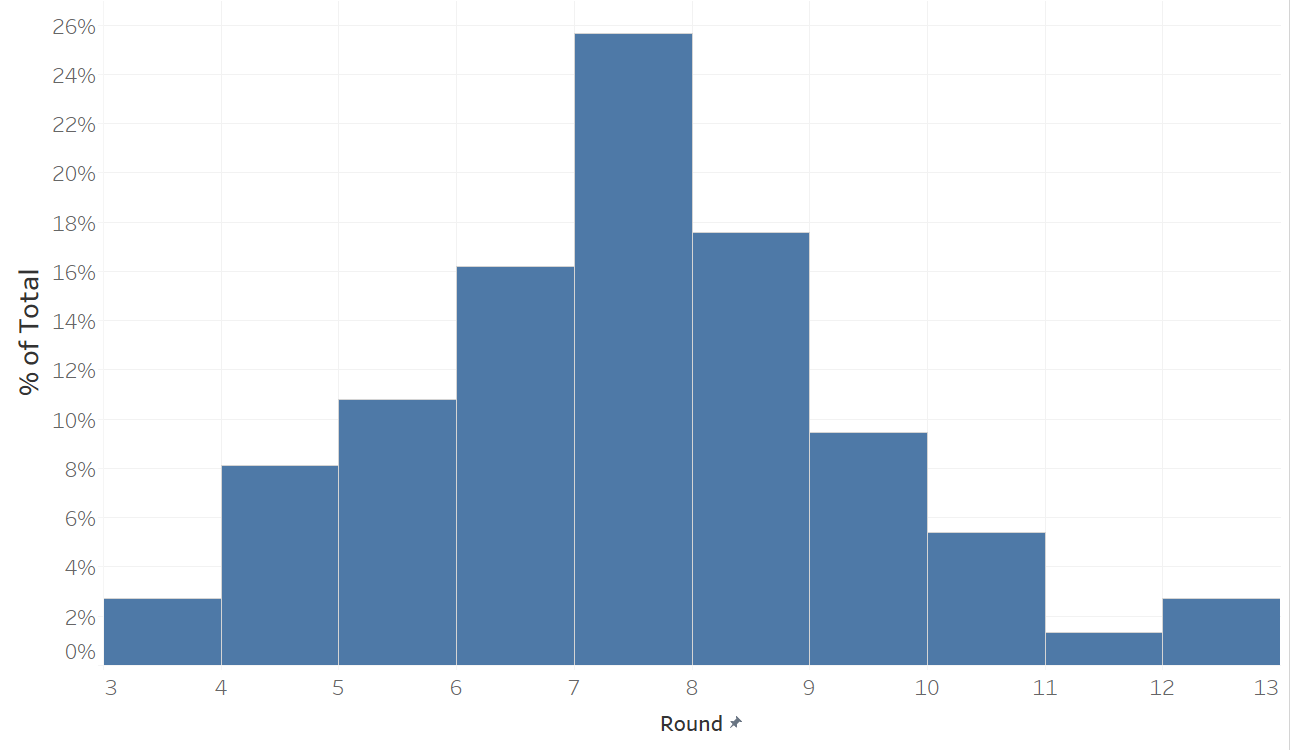
Most teams that drafted six or seven running backs acquired three by the 7th round. So, despite the increased total of running backs, both wide receivers and tight ends were still equally or more valuable than running backs. Tarik Cohen (3rd in RB win rate) and Marlon Mack (10th in RB win rate) were also drafted in this range aiding the case for the mid-round backs. To take it a step further, the same study was conducted with four running backs as the threshold.
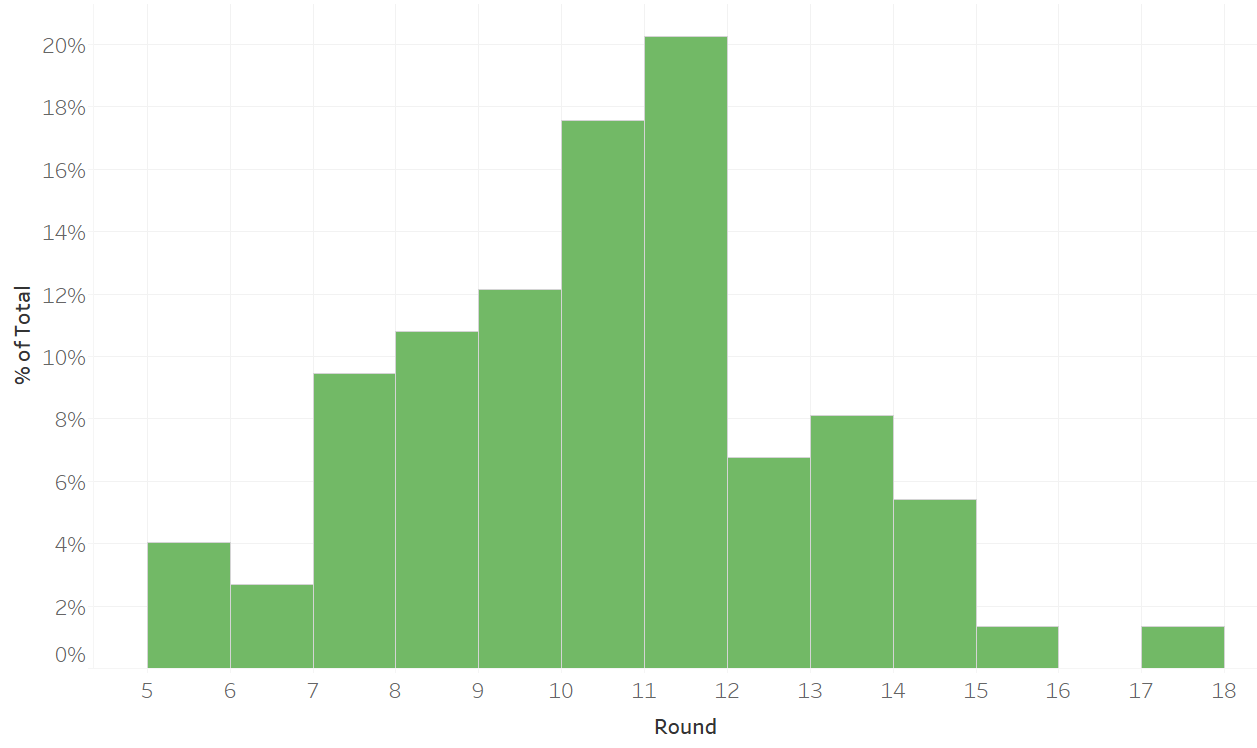
Here, the majority shifts from the 7th round to the 11th round. That’s four full rounds. Think about that. Roster constructions incorporating six or seven running backs had a clear edge in best-ball drafts. Most winning teams had taken four by the 11th round. That means two to three more running backs were selected past this point. Examples of players typically selected in these ranges:
| Chris Carson | Nick Chubb |
| James White | Matt Breida |
| Austin Ekeler | James Conner |
These players, coupled with the trends pulled from the data, outline a general structure that can be applied even in 2019 for drafting running backs. These results also point to the value of wide receivers that can go overlooked as drafters clamor for running backs. Taking this into context, along with roster construction, will be critical when drafting in 2019.
Takeaways
Think of ADP as a mix of perceived talent and ease of projecting volume. We understand how offenses are run, who the primary personnel is, and a team’s outlook from a total points perspective. But ADP doesn’t account for change. Best-ball rosters…winning best-ball rosters…must.
Projected volume captures the early season. Shifts in volume (e.g. injury, trade, coaching change) captures the mid to late season. Making investments in players across both categories covers the full season and should increase your chances of winning. It injects risk into your roster, but the process should encapsulate the fundamentals of building a winning team.

Fantrax is one of the fastest growing fantasy sites of 2018. With multi-team trades, designated commissioner/league managers, and drag/drop easy click methods, Fantrax is sure to excite the serious fantasy sports fan – sign up now for a free year at Fantrax.com.