
First off, I want to thank all who read and promoted the first article of my: “How to Use Statcast” series. Last week, we looked at six different hitter metrics on Baseball Savant and how to use those metrics for Fantasy Baseball. The statcast metrics discussed were; Average Exit Velocity, EV on LD/FB, Hard-Hit Rate, Barrel Rate, Launch Angle, and Sweet Spot percentage. The series continues today as we look at more statcast and hitting metrics that are useful when evaluating a hitter.
Here is a list of statcast and other metrics this article will cover:
- Expected Batting Average
- Expected Weighted On-Base Average
- Expected Slugging Percentage
- Plate Discipline Metrics
- Batted Ball Data
What?! Your league didn’t use Fantrax this past season? Inconceivable! Check out everything Fantrax has to offer and I’m sure you’ll come around to our way of thinking.
Statcast Data and What It Means
First, I want to preface this by saying, I am still learning. I am not a statcast expert by any means, but I want to share what I have learned with others. I want to show you how I use statcast data to help analyze players for Fantasy Baseball. I hope you find this article helpful.
Baseball Savant Profile

When you first get to a player’s profile on Baseball Savant, you will find a nice picture of the player with the player’s position, whether they bat/throw right or left, the player’s height, weight, and their age. If you move to the right-hand side of the page, you will see MLB Percentile Rankings. This is a list of several different statcast numbers and their percentile rankings among hitters or pitchers.
You can see that Juan Soto ranks exceptionally well in almost every hitting category in the picture above. When a player ranks well in a category, you will see color and a percentile. If a player ranks highly, that data set will be red. As a player fades toward the 50th percentile, that color will fade red and eventually turn to blue. For instance, on the other extreme like Soto’s Outs Above Average, the circle will be very blue.
It is easy to look at a statcast profile like Soto’s full of red and automatically assume that the player is good. The opposite can be said for a player with a lot of blue in his profile. The assumptions can be true, but it is worth understanding what each stat means and how it correlates to actual stats that matter for Fantasy Baseball.
Expected Batting Average
Expected Batting Average (xBA) is a statcast metric that measures the probability that a batted ball will become a hit. Every batted ball is assigned an xBA on comparable hit balls in terms of exit velocity, launch angle, and on topped or weakly hit balls, sprint speed.
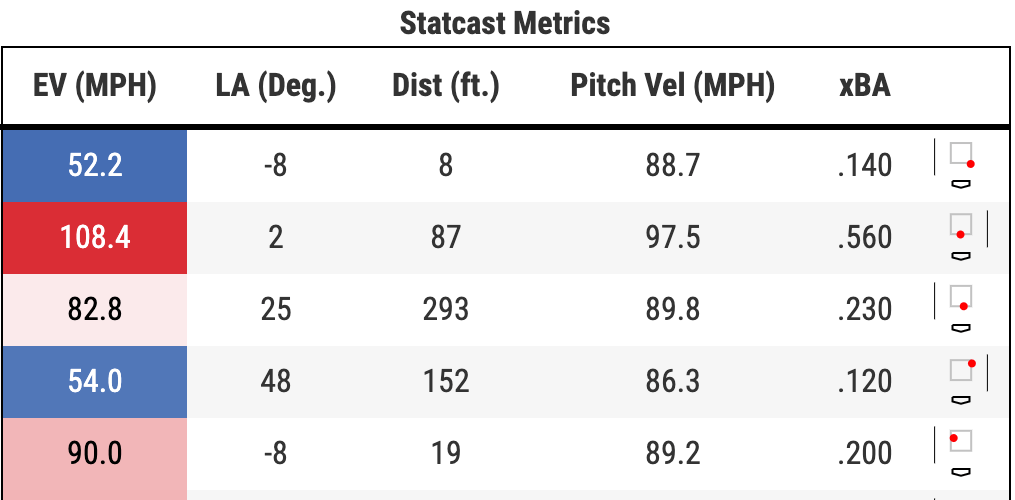
In the game feed picture above, you can see this played out. Each batted ball is assigned that xBA based on the factors mentioned in the previous paragraph. Using the expected outcomes of each player’s batted ball helps form their season-long xBA. Strikeout totals are factored into the equation, resulting in a player’s overall Expected Batting Average.
Fantasy Implications:
Expected Batting Average can help give more of a player’s true skill level than regular batting average. xBA removes defense from the equation, meaning the results are based more on the hitter’s skill level. Because hitters can influence exit velocity and launch angle to an extent, xBA is useful. Once the ball leaves the bat, a hitter has no control over the outcome.
Before 2020, I was able to identify Marcell Ozuna as a sleeper hitter thanks to having the largest differential in BA and xBA. Ozuna had a disappointing 2019 season, only hitting .241, but his xBA suggested he was unlucky and pegged him as a .291 hitter. This season, Ozuna mashed the ball in Atlanta and posted a .338 batting average with 18 home runs in just 267 plate appearances.
On the flip side, the largest 2019 over performer, according to xBA, was Fernando Tatís Jr, who batted .317 batting average but a .257 xBA. Tatís had a massive season for the Padres, hitting 17 home runs and stealing 11 bases, but hit just .277, including a .208 batting average of the final month of the season.
Expected Batting Average can be a useful statcast metric to use when evaluating hitters. Sometimes, you have hitters who constantly over or underperform their xBA. But other times, a player’s xBA can be both descriptive and predictive of a player’s future outcome.
Expected wOBA
In the same way that Expected Batting Average is calculated, Expected Weighted On-base Average is calculated similarly. Statcast data like exit velocity and launch angle are used. Still, xwOBA takes it a step further and assigns each batted ball a single, double, triple, or home run probability based on the results from comparable batted balls since statcast was implemented in 2015.
All hit types are valued similarly for xwOBA as they are for wOBA. The formula for wOBA is: (unintentional BB factor x unintentional BB + HBP factor x HBP + 1B factor x 1B + 2B factor x 2B + 3B factor x 3B + HR factor x HR)/(AB + unintentional BB + SF + HBP). “Factor” that you see listed in the formula indicates the adjusted run expectancy of a batted ball event in the context of the whole season.
A player’s season-long xwOBA is calculated based on the batted ball data mentioned and factors such as walks, strikeouts, and hit-by-pitch. xwOBA is based on the batter’s quality of contact rather than actual outcomes and can be more useful.
Fantasy Implication
Marcell Ozuna was also the largest underperformer based on statcast xwOBA in 2019. While his actual wOBA was .336, batted ball data indicated it should be higher, which landed his xwOBA at .387. What did Ozuna do in 2020? He crushed baseballs and produced a wOBA of .444. Ozuna is a great example of how you can use expected ratio stats from statcast to potentially find a breakout hitter for the next season.
This stat is especially useful in OBP leagues, which are becoming increasingly popular in the Fantasy Baseball community. Did a hitter’s xwOBA suggest they under or overperformed? Often, it can be predictive of a player improving their OBP the following season.
Expected Slugging Percentage
Again, as the previous two stats mentioned, Expected Slugging Percentage is a statcast metric calculated using launch angle, exit velocity, and on certain batted ball types, sprint speed. All hit types are calculated and valued in similar for xSLG as they are for standard slugging percentage. Doubles are worth twice as much, triples three times as much, and home runs four times as much as singles.
The formula for slugging percentage is: (1B + 2B*2 + 3B*3 + HR*4)/AB). Knowing the expected outcomes of each individual batted ball from a player helps formulate the player’s xSLG. Like the other statcast metrics, Expected Slugging Percentage is based on the quality of contact rather than actual outcomes.
Fantasy Implication
Like xBA and xwOBA, Expected Slugging Percentage is useful because it can indicate a player’s true skill. Removing defense from the equation and using factors that a hitter can influence like exit velocity and launch angle can give a better idea of the hitter’s skill level.
Take Alex Bregman, for instance. In 2019, he posted a .592 slugging percentage. Statcast data suggested that his Expected Slugging Percentage was .465, making him the second-largest overperformer in slugging. What did he do in 2020? He struggled and posted just a .451 slugging percentage.
Nolan Arenado was another large overperformer in 2019. His actual slugging percentage was .583 while his expected was just .489. It could have been injury-related with him, but he posted just a .434 slugging percentage in 2020.
Expected averages are not always perfect, but oftentimes they can be useful when evaluating hitters for Fantasy purposes. You can check out the Statcast leaderboard for expected statistics here and see the largest over and underperformers for each statistical category.
Other Useful Stats To Evaluate Hitters
That covers the bulk of the Statcast data on Baseball Savant that is useful when evaluating a hitter for Fantasy Baseball. While we are talking about evaluating hitters and useful statistics, I want to provide you with a couple more useful data points when evaluating hitters for Fantasy Baseball. For this set of stats, let’s head over to Fangraphs.
Plate Discipline

Looking at the screenshot above, I love looking at a hitter’s plate discipline profile and look at the MLB league averages against them. The profile above is Juan Soto’s. As we know, Soto rates extremely well in Statcast metrics. But how does his plate discipline look?
Contact Percentage
One of the first metrics I look at is contact percentage. Contact percentage is simply the total percentage of contact made when swinging at all pitches. If a hitter has a low contact rate, it usually leads to inconsistent, streaky performance. Just look at the list of the worst ten contact percentages among qualified hitters. Nearly everyone on the list is a streaky performer. Look for hitters with solid contact rates like Juan Soto, who had an 81.9 percent contact rate.

Swinging Strike Rate
Swinging strike rate or SwStr% is how often a hitter swings at a pitch and misses. The league average in 2020 was 11.3 percent, which is right in line with the 2019 league average of 11.1 percent. Looking at the picture above, you will notice that Juan Soto posted an impressive 6.2 percent swinging-strike rate in 2020, which was 13th best in baseball. David Fletcher was the league leader at three percent.
Swinging strike rate has a strong correlation with contact rate. Luis Robert posted the league’s worst swinging-strike rate at 22.1 percent. Seven of the top ten worst hitters based on swinging strike rates were also among the worst ten in contact rate. The interesting thing is, there are some intriguing Fantasy players among them. Luis Robert, Keston Hiura, Adalberto Mondesi, and Javy Baez are among the high upside players who struggle to make contact. These are players that I typically like to avoid for Fantasy, with some exception.
O-Swing Percentage
O-Swing percentage, or Chase Rate, referees to pitches outside of the zone that a hitter swings at. This stat is helpful in understanding how good a hitter is at laying off bad pitches. The league average is right around 30 percent.
Cavan Biggio and Mike Trout had the two lowest O-Swing percentages in the league in 2020 at 16.3 and 17.4 percent. Biggio posted a 15.5 percent walk rate, while Trout was just a tick below at 14.5 percent. Often times, a low chase rate means a high walk rate. On the flip side, take a look at Hanser Alberto who had a league-leading 54 percent O-Swing percent. His walk rate was a mere 2.2 percent.
If you are in an OBP league, be sure to take a look at O-Swing percentage as it can be useful in identifying hitters who typically walk at a high rate. Also, hitters with a higher O-Swing percentage can fall into the category of poor contact. The correlation is not as strong here. But O-Swing is a stat worth looking into.
Batted Ball

When looking at a hitter’s batted ball profile, there are several things that I look for. First, is a hitter’s spread of ground balls, line drives, and fly balls. Take a hitter like Vlad Guerrero Jr. for instance. He hits the ball extremely hard but also pounds it into the ground at a rate of 54.6 percent in 2020. It is also surprising that Juan Soto hit the ball on the ground 51.6 percent of the time in 2020. Groundball rate is not always telling as in Soto’s case. But it is worth monitoring if a player hits the ball on the ground too often.
I like finding hitters who have a high line drive rate. Why? Let’s take a look at some results from 2020.
Here are the batting average results based on batted ball types in 2020:
- Line Drives: .642
- Ground Balls: .238
- Fly Balls: .166
It is clear that line drives produced the highest batting average. Now, let’s take it a step further. If you factor in hard-hit balls of 95 miles-per-hour or harder. It is clear that line drives reign supreme when it comes to a player’s batting average.
- Hard-Hit Line Drives: .704
- Hard-Hit Fly Balls: .390
- Hard-Hit Groundballs: .360
Picking up on a player’s changed batted ball profile can help you identify breakout hitters. Look at Eric Hosmer. There were reports of him buying into the launch angle revolution this spring. His groundball rate dropped eight percent in 2020 and his line drive rate increased by nearly ten percent. Hosmer posted his highest batting average since 2017 and was on a 162 game pace of 38 home runs, 98 runs, and 153 RBI. Those would all be career highs. Finding a player who has an increased fly ball and pull rate can also be a sign of a potential breakout.
Speaking of pulled balls, looking a player’s pull/center/oppo batted ball distribution can be useful. The best way to hit for power is for a hitter to pull the ball. Having an evenly distributed spray chart is the best way to hit for a high average because defenses cannot shift against you.
Prior to Jose Ramirez’s big breakout in 2017 and 2018, he steadily increased his fly ball and pull rate. In his full coming-out party in 2018 when he hit 39 home runs, he posted a 45.9 percent fly-ball rate and 50 percent pull rate. Those two factors were a big reason for the home run growth. This goes to show identifying hitters joining the pulled fly ball revolution could be in for a big power breakout.
Well, that was fun! Let’s do it again next week, as we will dive into statcast data useful when evaluating pitchers. If you missed part one of the series feel free to check out “How to Use Statcast Data for Hitters.”
In the meantime, our prospect guru Eric Cross dropped his updated “Top 250 Fantasy Baseball Prospects.” It is well worth your time.
The 2020 MLB playoffs are in full swing but we are already preparing for next year. Keep track of all our 2020-21 MLB Offseason Analysis.

Fantrax was one of the fastest-growing fantasy sites of 2018/2019 and we’re not slowing down in 2020! With multi-team trades, designated commissioner/league managers, and drag/drop easy click methods, Fantrax is sure to excite the serious fantasy sports fan – sign up now for a free year at Fantrax.com.