
We’re delighted to welcome Draft Premier League Community member @Draft_FPL to Fantrax HQ for a special guest article. @Draft_FPL is well known in the Community for his statistical analysis, and here he takes a deep dive into Floors, Ceilings, and Standard Deviation! This statistical analysis will help in your quest for Fantasy EPL glory.
Looking for a better way to play Fantasy Premier League? The Fantrax draft-style EPL Fantasy Soccer Leagues are the most feature-rich, easy-to-use, and customizable in the industry. Sign up now to enjoy the incredible experience that is a Fantasy EPL Draft League on Fantrax!
Floors, Ceilings, and Standard Deviation
The terms ‘floor’ and ‘ceiling’ are often used in the Draft Premier League Community to describe a certain kind of player. However, the terms are a little vague and mean different things to different people. ESPN’s fantasy (American) football glossary defines them as:
- Ceiling: ‘The maximum statistical upside a player has for a week, season or career. A high ceiling means the player has the potential to score a lot of fantasy points. A low ceiling means he sports little upside.’
- Floor: ‘The lowest expected statistical production a player has for a week, season or career. A high floor means the player should provide consistent fantasy production. A low floor means he carries a notable risk of doing little or nothing statistically.’
Why Do These Terms Matter?
In head-to-head scoring, as we use on Fantrax, consistency is important, far more so than in Official FPL. To highlight this, if I had scored 110 every week in Draft Community League B, I would have won 21 of 29 matchups. But if my scores had alternated between 150 and 70 (same total points) I would only have 17 wins.
High floor players who reliably get you points, while rarely doing anything spectacular, are the lifeblood of a successful draft team. Conversely, every now and then you will be in a situation where you need an unlikely 20 points to win and you must choose between two players. In this case, you want the one with the higher ceiling.
Which Players Have High Ceilings, And Which Have High Floors?
Conventional wisdom assumes that goal-dependent players like Vardy and Aguero tend to have high ceilings and low floors, capable of a 40-point haul but also an abysmal -0.5. Defensive midfielders like Ndidi and Kante are expected to have low ceilings but high floors due to their reliable points from ball-winning. As you will see this is not always the case.
I propose a simple method to remove conjecture and focus on data instead, using standard deviation to create a statistical ceiling and floor for each player. Standard deviation, for those who are a little rusty, reflects how spread out the numbers in a group are in relation to the mean. With five scores over 20 but eight scores under 5, Sergio Aguero has the highest standard deviation in the league (13.1) while Fabian Delph has the lowest (2.2), with a highest score of 7 and a lowest score of 0.5.
In other aspects of life, like the stock market, standard deviation is used to measure risk. The same principle can be used in Draft Premier League: for two players with the same average (expected return), you want the one with the lower standard deviation (risk).
A Statistical Measure
Using standard deviation, we can create a statistical measure for floor and ceiling.
Simply:
- Ceiling = average (or PPM) + standard deviation
- Floor = average – standard deviation
Using the 68-95-99.7 rule (and assuming normal distribution), a player can be expected to score above their floor (and below their ceiling) approximately 84% of the time.
High Floor Players
With these definitions I have created a list of the most reliably high-scoring players in the game. Below are all the players who have a floor of 5 or more, with a minimum 700 minutes played in the Premier League this season:
| Player | Avg. | SD | Floor |
|---|---|---|---|
| Kevin De Bruyne | 19.5 | 10.6 | 8.9 |
| Marcos Alonso | 16.1 | 9.0 | 7.1 |
| Sadio Mane | 15.3 | 9.1 | 6.2 |
| Willy Boly | 11.9 | 6.1 | 5.8 |
| Marcus Rashford | 14.3 | 8.5 | 5.7 |
| Mohamed Salah | 15.2 | 9.8 | 5.2 |
| John McGinn | 11.3 | 6.1 | 5.3 |
| James Ward-Prowse | 9.9 | 4.9 | 5.0 |
| James Maddison | 12.7 | 7.7 | 5.0 |
It is no surprise that KDB comes out on top given he is the highest-scoring player in the league and has a lowest score of 6.5. No other player with 700+ mins played comes close in terms of the highest lowest score (Antonio, on 3 points is next). Marcos Alonso’s first appearance of the season was 1 minute off the bench against Norwich (0.5 points). Since then he has averaged 17.6 with a lowest score of 9.5. Unbelievable consistency and clearly a must-start when he has selected (especially when playing wing-back).
Willy Boly has registered a double-digit score in 9 of his 13 starts and, other than a blip against Tottenham (-1.75), he has been a rock at the back for Wolves, who only managed one clean sheet in the sixteen games he was absent. John McGinn also deserves a mention; his floor is 6.6 if you discount the 8 minutes he played against Southampton before coming off injured. How Villa (and many Fantrax managers!) have missed him.
High Floor Players (Non-Premium)
Most of the players in the previous table are premium players who you would play regardless of their floor. We want to look at lower scoring players who might have gone under the radar but will get you consistent returns. If we filter out players with a PPM greater than 10 (and maintain the 700+ minutes played requirement), this is the list of all players with a floor greater than 3:
| Player | Avg. | SD | Floor |
|---|---|---|---|
| James Ward-Prowse | 9.9 | 5.0 | 5.0 |
| Chris Basham | 8.9 | 5.0 | 4.0 |
| Enda Stevens | 9.1 | 5.3 | 3.8 |
| Declan Rice | 7.1 | 3.6 | 3.5 |
| Harry Maguire | 9.5 | 6.1 | 3.4 |
| Davy Propper | 7.3 | 3.9 | 3.3 |
| Wilfried Zaha | 8.7 | 5.4 | 3.3 |
| Jack OConnell | 8.9 | 5.6 | 3.3 |
| Oliver Norwood | 7.9 | 4.6 | 3.3 |
| James McArthur | 7.4 | 4.3 | 3.0 |
| Gylfi Sigurdsson | 8.4 | 5.3 | 3.0 |
Some of the obvious candidates like Ndidi (Floor: 2.7) and Kante (2.0) are missing but there are still five central midfielders, plus three Sheffield Utd defenders (Chris Wilder must be proud) and two players in Sigurdsson and Zaha (ADPs of 15 and 27) who should have been too good for this list but had shocking falls from grace. Minutes played is a helpful factor here; all except Sigurdsson have played over 2000 minutes while JWP, Rice and Maguire have so far played every minute this season.
Ward-Prowse, Southampton’s ‘secret shithouse’, got off to a slow start (only one double digit score in his first eight GWs) but since then he has been the dream draft fantasy player thanks not only to his outstanding set piece delivery but also his industrious ball-winning in the midfield. Rice and Propper’s low averages may put you off but if you are desperate for consistent returns in 12-team leagues (or deeper), they are your guys.
Using This Information To Your Advantage
We can use the data to determine whether a player is a reliable, fixture-proof ‘set-and-forget’ type or whether they need to be rotated with caution. Looking at the graph below, players above the trend line are more reliable, and those below more unreliable.
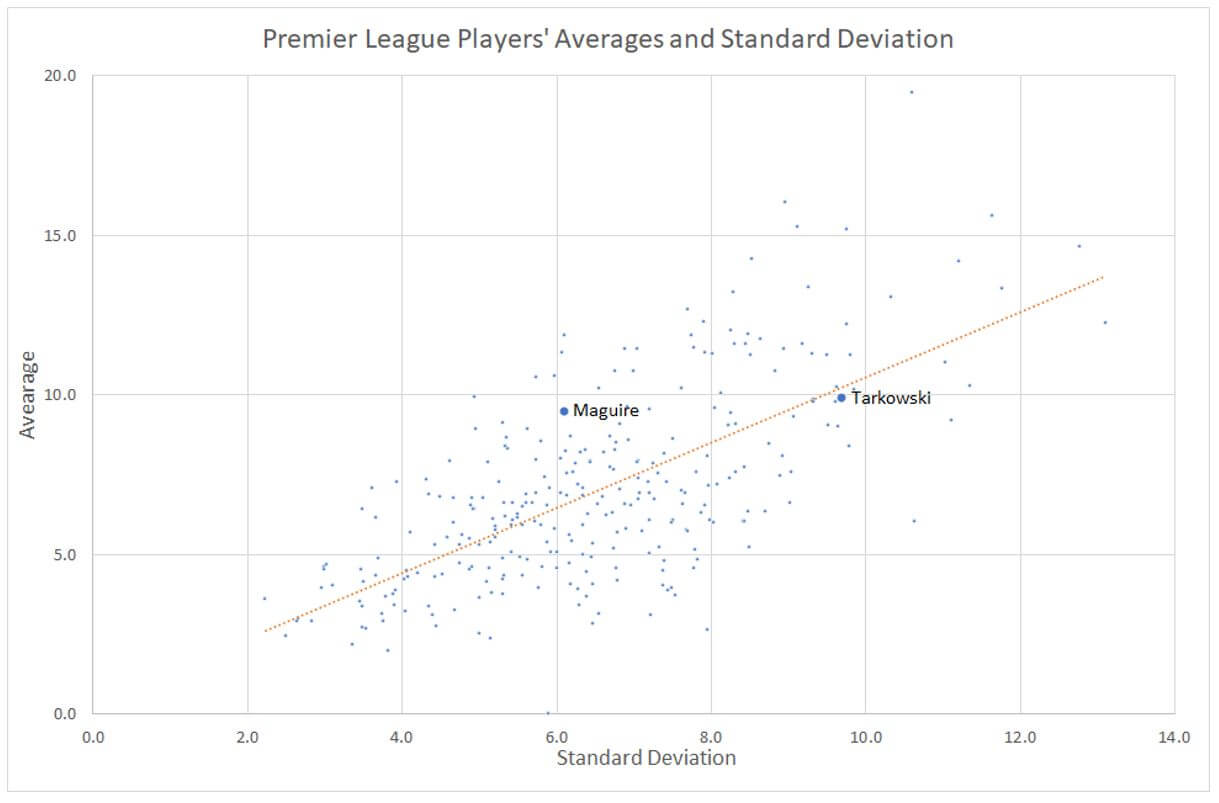
Let’s use Burnley’s James Tarkowski and Man Utd’s Harry Maguire as an example.
| Tarkowski | Maguire | |
|---|---|---|
| Avg. | 9.9 | 9.5 |
| SD | 9.3 | 6.1 |
| Floor | 0.5 | 3.4 |
As you can see above, Tarkowski has a good average of 9.9 and is currently ranked 29th overall, despite an ADP of 100 (Burnley players are perennially undervalued, but that is another article). However, his floor is 0.5 making him unreliable. As you can see in his Splits section on Fantrax, he averages 17.1 in victories but only 3.5 in defeats, while Maguire has a much more consistent 14.3 and 7.1 split. Tarkowski has had scores of -4 vs Chelsea, -5 vs Sheffield Utd, -1.5 vs Arsenal and 0.25 vs Aston Villa (all away from home for what it’s worth). You can draw your own conclusions as to when to play or bench Tarkowski but the bottom line is his inconsistency gives you something to worry about and could cost you your matchup. Give me the slightly lower averaging but more reliable Maguire any day.
Inconsistent Players and Preferable Alternatives
Here is a list of other players whose statistical inconsistency makes them less desirable than their more reliable counterparts:
- Chilwell (Average 10.3, Floor -1.1); Azpilicueta (10.2, 3.7). Chilwell’s majestic GW10 score of 54.25 has inflated his average. His median score (often a better measure of central tendency) is only 8.3.
- Pulisic (11.0, 0.0); Dele (10.8, 1.9). Pulisic has the superior PP90 (14.7 vs 12.1) but he has not been able to get consistent minutes. Even when he starts, he is often substituted; the young American has only played the full 90 minutes five times this season.
- H. Barnes (10.2, 0.3); Ward-Prowse (9.9, 5.0). Barnes has an excellent PP90 (14.4) but, like Pulisic, he rarely plays 90 minutes. You cannot beat JWP’s reliability.
- Ayoze (9.2, -1.9); Wood (9.1, 0.8). Like his teammate Chilwell, Ayoze’s average is inflated by one massive score. His median score is only 4.5.
- Pukki (9.0, -0.6); Zaha (8.7; 3.3). Pukki is goal reliant, Zaha is not.
- Lundstram (8.4, -1.4); Soyuncu (8.3, 1.9). He is an Official FPL darling, but he’s too inconsistent for Fantrax. A lowly median of 4.3 compared to Soyuncu’s 7.4.
- Mee (8.1, 0.1); Burn (8.0, 2.0). Mee suffers from the same issues as his partner Tarkowski.
High Ceiling Players
| Player | Avg. | SD | Ceiling |
|---|---|---|---|
| Kevin De Bruyne | 19.5 | 10.6 | 30.1 |
| Riyad Mahrez | 14.7 | 12.8 | 27.4 |
| Trent Alexander-Arnold | 15.6 | 11.6 | 27.3 |
| Son Heung-Min | 14.2 | 11.2 | 25.4 |
| Sergio Aguero | 12.3 | 13.1 | 25.4 |
| Jamie Vardy | 13.3 | 11.8 | 25.1 |
| Marcos Alonso | 16.1 | 9.0 | 25.0 |
| Mohamed Salah | 15.2 | 9.8 | 25.0 |
| Sadio Mane | 15.3 | 9.1 | 24.4 |
| Jack Grealish | 13.1 | 10.3 | 23.4 |
| Marcus Rashford | 14.3 | 8.5 | 22.8 |
| Adama Traore | 13.4 | 9.3 | 22.7 |
| Christian Pulisic | 11.0 | 11.0 | 22.0 |
This table is more predictable as there is a strong correlation between high averages and high ceilings.
All players featured here have a PP90 of over 14 except Grealish, who has been both a revelation and frustratingly inconsistent in his return to top-flight football. For a man who has played nearly every minute of this Premier League season he has put in some woeful scores, especially away from home: -3 vs Crystal Palace, 0.5 vs Man City, -1 vs Sheffield Utd, -1.5 vs Southampton, and 0 vs Leicester all came on the road. Of course, this is balanced out by some majestic home scores; his home/away split of 17.1/9.5 is one of the biggest discrepancies in the game.
Of the remaining players with a PP90 over 14 not featured in the High Ceiling table, only Buendia and Jimenez average more than 70 minutes per game. Jesus, D. Silva, Antonio, Willian, H. Barnes, and B. Silva would have higher ceilings (and averages) if they got 90 minutes more often. Jimenez has only scored two goals (or more) in a game once this season so he is consistent rather than explosive while Buendia, who has been creating plenty of chances for his teammates but is yet to score, only has 8 shots on target, the same as defenders Alexander-Arnold and Maguire.
High Floor and High Ceiling
De Bruyne, Alonso, Salah, Mane, and Rashford are the elite five who make both the high floor and high ceiling list. Three of them were obvious first round picks but I don’t think people have appreciated quite how much Rashford has improved this season. Alonso remains the ultimate bad-in-real-life-great-in-fantasy example (with Mustafi probably a close second) although his sample size of 859 minutes isn’t much above the threshold of 700 so some reversion to his historical mean (12.3 over the last 3 seasons) would not be surprising.
Top Players With Under 700 Minutes Played
Players with under 700 minutes played have been omitted from this article as the sample size is not large enough to be reliable but for those interested here are all players who have played under 700 minutes with an average over 8:
| Player | Minutes | Avg. | SD | Floor | Ceiling |
|---|---|---|---|---|---|
| Fernandes | 447 | 17.7 | 9.2 | 8.5 | 26.9 |
| Matip | 631 | 11 | 7 | 4 | 18.1 |
| Pedro | 656 | 10.8 | 8.5 | 2.3 | 19.2 |
| Mustafi | 620 | 10.4 | 6.3 | 4.1 | 16.7 |
| Duda | 581 | 10 | 5.7 | 4.3 | 15.7 |
| Pogba | 521 | 9.9 | 6.4 | 3.5 | 16.4 |
| Bergwijn | 417 | 8.7 | 6.4 | 2.3 | 15.1 |
| Barkley | 675 | 8.1 | 10.9 | -2.8 | 19.1 |
| Dann | 635 | 8.1 | 6.3 | 1.7 | 14.4 |
| Iheanacho | 583 | 8 | 8.2 | -0.2 | 16.2 |
| Tanganga | 526 | 8 | 6 | 1.9 | 14 |
Fernandes has quickly taken to the Premier League and is an obvious first-round pick next season while center-backs Matip and Mustafi are reliable picks when they play. Barkley has been the archetypal boom-or-bust player this season; in eight starts and five substitute appearances he has had three great scores (20.5, 18, 37) but no other returns above 6.5.
Summary
With only nine GWs left and the new five-player substitution rule coming into effect, the high floor players mentioned in this article are unlikely to match the reliability they have shown up till now. However, I hope this article sheds some light on an under-analyzed aspect of Draft Premier League while also generating some debate on how we measure player reliability. You can find me on Twitter @Draft_FPL; I’d love to hear your thoughts, critical or otherwise!
Wondering who the best current Draft Premier League players are to target? Look no further than our Top 150 Player Rankings!

Fantrax was one of the fastest-growing fantasy sites of 2019, and we’re not letting our foot off the pedal now! With multi-team trades, designated commissioner/league managers, and drag/drop easy click methods, Fantrax is sure to excite the serious fantasy sports fan – sign up now for a free year at Fantrax.com.
Hey, I enjoyed the article. Just wanted to point out that this seems unclear:
“Ceiling = average (or PPM) + standard deviation
Floor = average – standard deviation
Using the 68-95-99.7 rule (and assuming normal distribution), a player can be expected to score above their floor (and below their ceiling) approximately 84% of the time.”
Players would be expected to score above their floor 84% of the time, but above their floor and below their ceiling 68% of the time as defined unless I am missing something.
The floor to ceiling range includes the -1 standard deviation to +1 standard deviation portion of the distribution as defined, thus 68%. If we add the +2 and +3 standard deviation outcomes then we get to 84%. (assuming normal distribution, of course).